Using climate information to support adaptation planning and policy-making: Step-by-step guide
Introduction
This article describes how weADAPT can be used together with the Climate Information Portal (CIP) to quickly and easily access climate data for many locations across Africa, using an interactive map. (This functionality may be expanded to other regions, based on demand.) By linking the two portals, we have enabled users to see the climate data context as you read about a project, or to find data to support your own research, project planning or policy design in a specific place or area.
This guidance is based on an understanding that adaptation is not simply a technical exercise in reducing projected climate impacts. Rather it is a process of socio-institutional learning in a specific context, involving multiple people and organisations that have a stake in the present and the future of that place, who are making complex, multi-faceted choices about managing climate-related risks and opportunities, often in the face of resource constraints and competing agendas. Information about these climate risks, opportunities and adaptation options is never going to be perfect or perfectly complete; there will always be some sources of uncertainty, but that does not mean that a robust and defensible decision cannot be made. What is required is accountable leadership and broad-based deliberation that brings together multiple perspectives, knowledge, expertise and value sets.
The guidance is designed for use by technical staff working in government agencies and non-governmental organisations, as well as researchers and consultants involved in planning and policy processes, particularly at sub-national levels. Using the guidance requires a basic to moderate level of knowledge on climate dynamics, the interactions between environmental, social and economic systems, as well as statistics. If you need more training on these topics, we recommend the annual short-course run by the Climate Systems Analysis Group, referred to as the Winter School. The guidance is accompanied by 2 case studies that apply the guidance in the contexts of: 1) urban land use planning in a suburb of Cape Town, South Africa 2) agriculture and fisheries based livelihoods in Bagamoyo District, Tanzania As you’ll see from step 8 below, we hope to further expand on this set of case studies as more people make use of the guidance.
Prior to looking at the climate data
Before you embark on this process, you should conduct a basic vulnerability assessment, which will provide the foundation for your work. In such an assessment, you will identify the key climate sensitivities in your study area or project site, based on the livelihoods / economic activities practiced and the infrastructure and services relied upon there. You might ask questions such as: When have climate impacts been experienced in the past? What time of year was it (episodes to look at in the climate data)? How often does it happen? What else was happening at that time that compounded the unfavourable climate conditions and made the impacts worse?
Step 1 – Define the question
With that knowledge in mind, clearly define the question you wish to answer when looking at the climate data. For any location, there may be a wide range of climate data available, only some of which are relevant to what you are doing – for example, temperature projections are unlikely to be relevant in gauging future flood risks, but they would be in evaluating future irrigation needs. A clear planning or policy question will help you decide which data are important, and what level of detail is required. You should only include climate data and graphs in your reports that help explain the problem you are highlighting, the course of action you propose, and your reasons for selecting certain actions or interventions over other options.
Step 2 – View climate stations on weADAPT
Go to the map in weADAPT, called the Adaptation Layer. Turn on the climate stations with the “view climate stations” button at the top of the page. Go to the place on the map where you are working and look at what placemarks are around there in terms of stations where climate data is available (indicated by yellow sun icons). Also check the other placemarks in the area to see what other projects are going on there: Has anyone else already conducted a climate analysis, vulnerability assessment, done an impact assessment or implemented an adaptation plan in the vicinity of your project site and uploaded information about it on weADAPT that you can learn from?
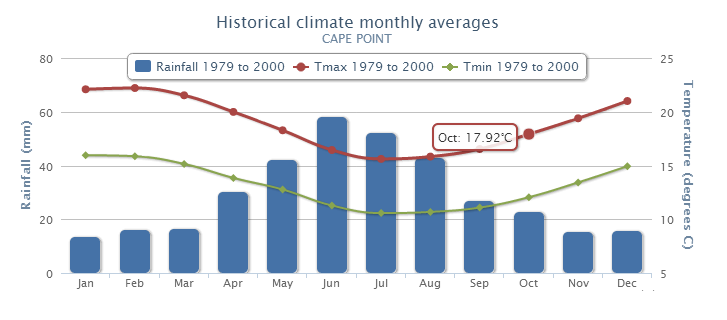
Click on the station closest to your study area or project site that has the most similar climate conditions. In some cases the closest station in terms of distance is not the most similar. Think about the influence of elevation, mountains, water bodies, forests, etc. when making your station selection. You will be shown a graph of historical climate monthly averages recorded at that location. Depending on your questions, you may want to look at data such as:
- When the rainy periods are – which month gets the most rainfall on average?
- The average temperature range through the year;
- What time period data are available for (how far back does the record go, and how recently does it end?).
You might like to download this graphic so that you can add it to your project documentation, because it gives a good overview of the average climate as it has been in this place over the last few decades. If the station is not close to your project / study site, you might want to add some text drawing attention to the extent that there might be local variability in the climate. The extent of such variability is place-specific, depending on the topography, land cover, proximity to the ocean, etc.
Step 3 – View historical climate data on CIP
Click through into CIP from the weADAPT placemark to look at more information that lies “behind” this overview of the historical climate at this station. Now you can look at the whole time series of the historical data (click on historical monthly data record), looking across all the years. Which climate variables are available in CIP? (Look at the drop-down menu.) How do these match up with the ones you wanted to look at, identified in Step 1? What extremes and patterns do you notice? What if the variables, derivatives and thresholds you are interested in are not shown in the graphs? You can download the raw data and create your own graphics.
If you can’t find station data for your city or project site on weADAPT or CIP, contact the national meteorological service and/or the local government office responsible for strategic information / GIS / scientific services and ask if they have data for your location. When you do, make sure to ask two important questions: Do they have the meta-data to give you, and has the data been quality-controlled? If not, then this needs to be done before you can use it. The Climate Systems Analysis Group (CSAG) will do it for you if they can add it to their dataset and use it for downscaling. However, do note that this may take a few months to complete, depending on workloads. Contact the CSAG team for more information.
If you are doing a project at the national or regional scale, you might want more aggregate information than data collected at individual stations / point locations.
Step 4 – View future climate projections
Next you can look at future climate projections. Clicking through to the future climate scenarios (also referred to as downscaled projections) for that station, you are presented with results from running numerous global climate models that have then been statistically downscaled to the station location. Look at the variables you are interested in and compare the spread of projections (generated by 10 different climate models) across the two different emissions scenarios (RCP 8.5 and RCP 4.5).
RCP stands for Representative Concentration Pathways, a new set of scenarios, based on different radiative forcing levels (linked to different concentrations of greenhouse gases), that are being used in generating the climate projections for the Intergovernmental Panel on Climate Change (IPCC) Fifth Assessment Report (due to be published in 2014). There are four RCPs. The climate projections based on two of these RCPs are presented in CIP. RCP 8.5 is the high-end scenario (most countries have continued with carbon intensive industries and lifestyles) and RCP 4.5 is the lower-middle scenario (emissions have been cut considerably, but more could still be done).
The default time period of projections displayed in CIP is 2040-2060, but you can change these on the slider bar as relevant to your needs.
While looking at the projections you might ask questions such as:
- What do these results suggest regarding the difference between what the climate has been in the recent past and what it might be by the middle of the century? Tip: Click on the grey “observed” series in the key of the graph to show the historical records “behind” the projected anomalies to show how big the projected (future) change is relative to the observed (historical) climate.
- Is there a clear direction of change at critical times of year that most of the models agree on? How much is that change? How wide is the uncertainty range? It is important to report the extent of projected change as a range, thereby communicating the spread of results from the various models (i.e. the extent to which the models agree or disagree).
Remember that we are looking at multi-year averages here, so the values for single years would vary on either side of these average figures. You may want to download a few of the most relevant graphs that help to illustrate the headline messages you are coming up with.
Step 5 – Look at data for other nearby stations
Close the content box to reveal the map behind it. Look at what other stations are also nearby the project site (check across the different datasets). Look at the data for one or two other nearby stations to see if they reinforce what you saw at the first station or whether anything shows up as being quite different, either in the historical patterns and/or the future projections. If there are notable differences, then you need to give some thought to why that might be the case (e.g. significant differences in height of the station above sea level), or ask others with the relevant expertise to help. Don’t ignore or smooth over those differences (e.g. by averaging); they may be important “red flags” about microclimates, inconsistencies in the historical climate record and/or about uncertainties in future projections. The decision-makers you are hoping to inform need to be aware of those considerations.
Step 6 – Ask, ‘so what?’
Look back over the information you have gathered during Steps 2 – 5 and ask: So what? What can you now say about how the climate has been in this place, how it might change in the future under various scenarios, and what this might mean for the people who live there, the work that they do, or the infrastructure and services that they rely on (i.e. the policy or planning question you set out to address in step 1). What could, and will you argue should, be done differently to adapt to current climate conditions and prepare for how these patterns might shift in the future?
Step 7 – Find other places facing similar issues
Go back into weADAPT and search the Adaptation Layer for projects elsewhere tackling similar climate risks to see:
- What adaptation options they are testing or promoting that might be worth considering as options in your study / project;
- Who has experiences of implementing adaptation measures that you might be able to learn from? (For example, how did they select which option to go for? How did they finance it? How are they monitoring the impacts?)
Step 8 – Add your story to weADAPT
Finally, document what you’ve done and add it to the weADAPT platform; the easiest way to do this is through the How to contribute help page. This way, if someone else wants to learn from your experience, or build on it further, they can. And if they need to do a climate assessment for their location, they can look at the steps you’ve followed as an example!
Climate analysis application in Cape Town from weADAPT Learn – Share – ConnectThis document has been produced with funding from the Climate and Development Knowledge Network (CDKN).
(0) Comments
There is no content