Using climate information to support adaptation planning and policy-making: A case study in Cape Town, South Africa
Summary
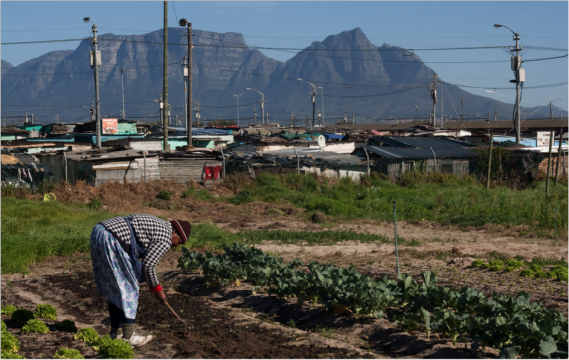
A vegetable farmer in Philippi, a suburb of Cape Town, South Africa. Source: FLICKR/KOSMOSELEEVIKE
Introduction
This case study focuses on land use management and zoning in a suburb of the city of Cape Town, South Africa, called Philippi. It follows each of the steps laid out in the guidance on using climate information to support adaptation planning and policy-making.
Currently a large part (approximately 2000 ha) of Philippi, referred to as the Philippi Horticultural Area, is zoned as rural and mainly used for farming vegetables. To a much lesser extent, there is also livestock farming (cows, sheep and goats). Carrots, cauliflowers, lettuce, cabbages and a number of other crops are grown year-round and harvested four or five times a year. These vegetables supply local supermarkets as well as local informal traders. The Philippi Horticultural Area is thought to yield about 40% (some estimate up to 80%) of Cape Town’s fresh produce and thus plays a key role in keeping healthy, nutritious food affordable. The farms also provide numerous jobs, especially low-skilled jobs, which are highly sought after in a city with roughly a quarter of the work force unemployed, many with very low levels of education.[1]
Philippi has a microclimate that keeps it cooler than its immediate surrounds in the summer, which is why it was earmarked for vegetable production a long time ago (mid-1800s) and remains highly productive.[2] The area overlays an aquifer making groundwater relatively cheap and easy to access by digging depressions where water collects (sump pits) and/or pumping from boreholes. However, it also makes many parts prone to regular flooding during the winter rainy season.
The city of Cape Town has rapidly grown around the farmlands and continues to do so. This places huge pressures on the land. Many Cape Town residents, both within the Philippi area and beyond, live in informal settlements (or slums), without land tenure, in temporary shacks and with only the most basic public services: communal taps and toilets, few access roads and open trenches for drainage. An estimated 400,000 households across the city qualify and are waiting for government subsidised housing that has been promised. This places huge pressure on the government to secure suitable tracts of land where low-cost housing can be constructed to meet this growing demand. This is also a very political issue because votes in the local, provincial and national elections are tightly linked to public service delivery, moving people out of conditions of poverty and informality.
Step 1 – Define the question
The planning question is: From an urban climate resilience/adaptation perspective, should Philippi Horticultural Area remain in use for vegetable production, or should it be rezoned from rural to urban and used to build low-cost housing?[3]
While there are of course many dimensions to making this choice, we have been asked to provide an input on the climate dimension of this question. We want to be able to say something about what climate risks farmers and farm-workers currently face, those that local residents face, and how these risks manifest as impacts. We then want to look at what projections of future climate suggest about how these risks might change in the medium to long term, so that decision-makers can factor these climate considerations into their land use zoning decisions, along with other priorities and decision criteria.
From a housing and mobility perspective we know that heavy winter rains are a key climate hazard that triggers extensive flooding in and around Philippi. Water collects in people’s homes (especially in shacks), and along footpaths and roads. This standing water often mixes with local sources of waste and sewage. It makes people sick, makes it difficult to travel to work and school, damages household goods (furniture, electronics, clothes, bedding, etc.), and keeps people from doing other tasks because they spend their time bailing water.
Many residents of Philippi are particularly vulnerable to these climate impacts because they have pre-existing low levels of nutrition, immunity and poor health (many suffer from tuberculosis, and HIV prevalence is high). Local clinics and hospitals are overburdened and under-resourced, so access to health care is highly constrained. In addition, many Philippi residents who have jobs do low-skilled work and are readily fired and replaced if they miss work. Most households also have very low monthly incomes and no insurance cover, such that replacing possessions damaged by floodwaters is unaffordable.[4]
From a vegetable production perspective, excessive summer heat can be a problem. In prolonged hot, windy spells, plants can suffer from heat stress, scorching, sunburn and ultimately death.
Thus, we want to look at both the available rainfall data, as it relates to flooding (i.e. how much rain falls per month, how many days it rains per month, how heavily it rains within a day, etc.), and temperature data, as it relates to heat stress (i.e. daily maximum temperatures, number of very hot days, etc.).
Step 2 – View climate stations on weADAPT
When looking at Cape Town on the Adaptation Layer in weADAPT, we find two stations, one of which looks to be quite close to the Philippi area. Clicking on it shows that it is positioned at Cape Town International Airport. The graph of the historical climate monthly averages (see Figure 1 below) shows that:
- There is an observed data record stretching from 1979 until 2000;
- The rainy season starts around April/May and coincides with the onset of the colder winter season (on average 17.5°C maximum and 7°C minimum in July);
- June and July are the months that have had most rainfall, an average of 100.47 mm and 93.49 mm, respectively;
- The rainy season tapers off in October, followed by dry and hot summer months from December through to March, with average monthly maximums peaking at 26.6°C in February.
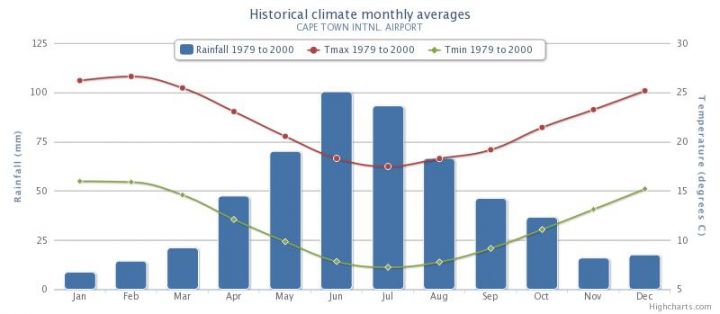
Figure 1: Climate monthly averages at Cape Town International Airport, 1979–2000
Step 3 – View historical climate data on CIP
By clicking through to further explore this data in the Climate Information Portal (CIP), we can go on to look at the full timeseries “behind” these averages for numerous temperature and precipitation variables. The timeseries of total monthly rainfall (see Figure 2 below) clearly shows the seasonal cycle, the winters generally reaching around 100 mm per month. It also show considerable variability between years, with some relatively dry winters (e.g. 1988) and some particularly wet years in which there are months that significantly exceed this average (e.g. 1991 and 1993), when the risk of extensive flooding was particularly high.
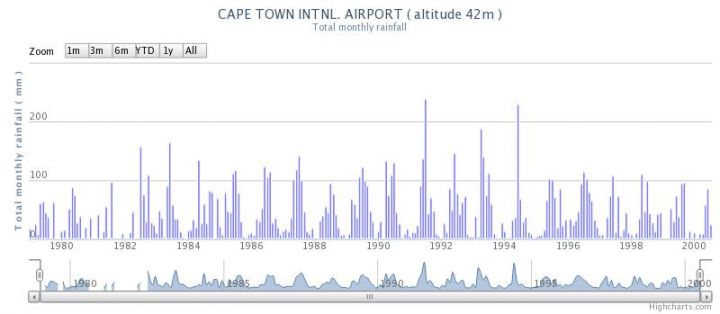
Figure 2: Total monthly rainfall, Cape Town International Airport, 1979–2000
It might not only be total monthly rainfall that indicates high flood risk, but also how many days in the month it rained and/or how many days in the month received heavy downpours (i.e. the distribution of rainfall within a month). These aspects of how heavily and for how long it rained have considerable implications for the saturation of the ground and the volumes of runoff, which translate into flooding.
By looking at the number of rain days per month and the number of heavy rain days (defined as over 10 mm) it becomes clear that the months with most rain days and/or the heaviest rain days do not all correspond with the months with the highest total monthly rainfall. The months that do stand out as having particularly high numbers all round, when extensive flooding would be expected, are shown in Table 1 below.
Table 1: Months with highest total monthly rainfall, Cape Town International Airport
|
Month and year |
Total rainfall |
Total rain days |
Total heavy rain days (>10mm) |
|
June 1983 |
164.10 mm |
13 |
5 |
|
April 1990 |
133.50 mm |
16 |
5 |
|
July 1990 |
131.20 mm |
16 |
4 |
|
July 1991 |
239.20 mm |
15 |
6 |
|
April 1993 |
188.80 mm |
7 |
4 |
|
June 1994 |
230.00 mm |
17 |
9 |
The observed temperature data at this station similarly shows a very clear annual cycle, but with some variability between years. It is striking that all the months with the highest average maximum temperature are in the last few years of the record. However, for our purposes of assessing risk of heat stress on vegetable crops, these monthly averages are not so useful. Rather, it is the temperature and number of days of extreme heat (i.e. daily maximum temperatures) that are of interest.
Step 4 – View future climate projections
Going on to look at the statistically downscaled CMIP5 projections for this station for the middle of the century, 2040–2060, most of the model results are indicating a slight decrease in average total monthly rainfall during the winter months of May, June, July and August. However, for July a few models indicate a possible increase in total monthly rainfall under the RCP8.5 scenario (high emissions), so this cannot be ruled out. This possible wetting is less evident under the RCP4.5 scenario (medium-low emissions), where the majority of models show a likely decrease in total monthly rainfall over the winter months. The counts of average number of wet days per month, those >5 mm and the heavy rain days, i.e. >20 mm and > 95 percentile of the observed, mostly show very slight decreases across the winter months for both RCP 8.5 and RCP 4.5. However, in some months the spread of model results span zero, particularly for June in the >20mm rain day projection (see Figure 3 below), which shows an average increase in the number of heavy rain days is also possible.
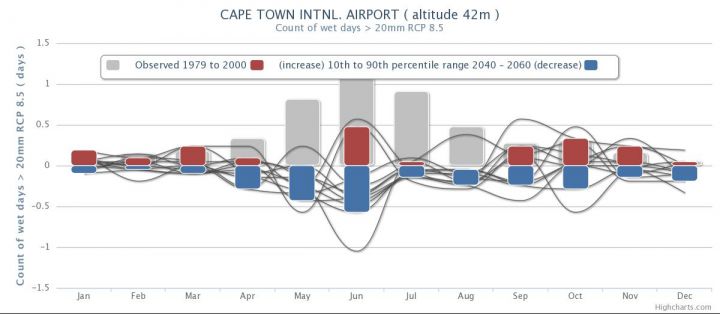
Figure 3: Anomalies in the count of wet days >20 mm at Cape Town International Airport station projected under RCP8.5
The downscaled general circulation model (GCM) projections using data from this station suggest that, in terms of rainfall, the risk of winter flooding is likely to stay similar to what it is now, or even reduce slightly, in the Philippi area. It is important not to jump too quickly to a conclusion after only looking at one station. We need to check if this pattern is evident at other stations too (step 5).
The temperature projections downscaled to this station show a clear increase in monthly average maximum temperature, about 1.5°C to 2.5°C in the summer months (January, February, March) under RCP8.5 and 1°C to 2°C under RCP4.5. However, the more useful variable for us is the count of very hot days, those with maximum temperatures exceeding 32°C. On average, between 1979 and 2000, there were one or two days per month of such heat in January, February and March. By the period 2040-2060 this is projected to increase by a further two or three days (i.e. the incidence of hot days >32°C could double or even triple), as shown in Figure 4. This could threaten the productivity of various crops unless adaptation measures are taken, such as covering with shade cloth and/or additional irrigation.
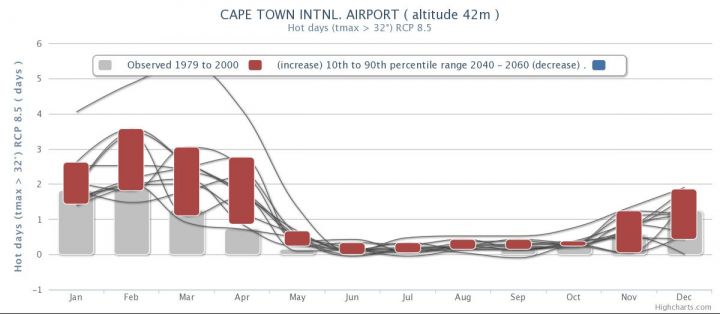
Figure 4: Anomalies in the count of hot days >32°C at Cape Town International Airport projected under RCP8.5 for 2040-2060
Step 5 – Look at data for other nearby stations
Looking through the data provided for two of the other stations in the broader region, the Cape Point and Cape Agulhas stations, the projections for winter rainfall in the months of May, June, July and August seem to show similar patterns that support our earlier conclusion.
In terms of temperature, the Cape Point station shows much smaller observed and projected numbers of hot days >32°C, but this might be expected because the station is right on the coast and so kept cooler by the influence of the sea. An inland station in the region, Robertson, shows much higher figures, with an average of nine hot days >32°C per month in January, eight in February and 5.5 in March observed in 1979-2000. The projections show this could increase by a further four to six days, three to five days, and 2.5 to 4.5 days, respectively, by the period 2040-2060 under RCP 8.5. This pattern of increasing hot days is consistent with the trend at the airport station, near Philippi.
Step 6 – Ask, ‘so what?’
The data for observed rainfall and projected rainfall suggests that flood risk is likely to stay similar to what it is now, or even reduce slightly. As discussed in the introduction section, the risk of flooding in Philippi is currently high, marked by the regular need for disaster response interventions, which means that adaptation is urgently required. The fact that the climate projections show a slight decrease in winter rainfall means that adaptation choices and investments can be designed around current levels of risk without concern that these will be exceeded in the coming decades.
However, rainfall is only one component of flooding. Whether an area floods and how badly it floods depends to a large extent on what the ground surface is, how much the rainwater runs off over the surface or seeps into the ground, what the groundwater level is, what drainage there is and how functional that drainage is (e.g. are the gutters and inlets blocked with litter and garbage?). Climate data cannot tell us this. We could therefore advise that while the climate data does not suggest an increasing risk of flooding linked to changing rainfall patterns, it would be worth modelling the hydrology of the area based on the range of current conditions experienced and see how the flood risk changes with a shift in surface cover from plants to paved surfaces.
The temperature data shows a clear and considerable increase in monthly average maximum temperatures projected by the middle of the century. Even more significantly, they suggest a sizable increase in the number of very hot days (exceeding 32°C), which poses a threat to vegetable crop yields in the Philippi area and thus to the viability of farming in the area, unless investments are made in adaptation measures such as installing shade cloth tunnels and increasing irrigation capacity. However, these adaptation measures could further strain the water availability in the area. That said, having housing instead of vegetable production could well increase the total annual water demand in the area even more. This is something that would require a detailed technical study to assess and be important in making a decision over zoning and potential changes in land use in the area.
Step 7 – Find other places facing similar issues
Searching the Adaptation Layer revealed a very interesting study on the effects of urbanisation and climate change on flooding in Quy Nhon City, Vietnam, which could provide some useful ideas and methods for taking this work forward. Searching the weADAPT site as a whole led to an article on water-sensitive urban design in the context of Australia that also looks like it could be very relevant to this question of flooding, stormwater management and increasing heat stress in Cape Town.
Step 8 – Add your story to weADAPT
We hope that developing and sharing this case study on using climate information to inform land use management decisions in Philippi, Cape Town, South Africa, will be useful to you in your work on adapting to current and emerging climate risks. If you go on to do a similar analysis please consider adding it to weADAPT as a case study like this one, so that others can benefit it. For guidance on how to share content via weADAPT go to: http://weadapt.org/knowledge-base/guidance/share
Climate analysis application in Cape Townfrom weADAPTThis document has been produced with funding from the Climate and Development Knowledge Network (CDKN).
[1] For more background, including the history and demographics of the area, see Anderson, V., Azari, S. and van Wyk, A. (2009). Philippi Community Profile. South African Education and Environment Project, Mowbray, South Africa.
[2] For a detailed history of the area and farming community see Rabe, L, 1992. Die Groenteboere van Philippi, Lantern, Special Edition, 1992. For a brief overview of the area’s heritage see City of Cape Town, 2007. Philippi Heritage Information Brochure, City of Cape Town Heritage advice pamphlet #16.
[3] This is a real and very contentious question being debated in Cape Town. See, for example:
Battersby-Lennard, J. and Haysom, G. (2012). Philippi Horticultural Area: A City Asset or Potential Development Node? Summary Report. Report commissioned by Rooftops Canada Foundation Inc. – Foundation Abri International in partnership with the African Food Security Urban Network, Cape Town, South Africa.
iKapa Enviroplan, ICE (Pty) Ltd and City Think Space (2012). Urban Edge and Development Guidelines Study for the Schaapkraal Smallholdings Area and Environs in the Philippi Horticultural Area. Report 1560/1.6. Status quo report prepared for the City of Cape Town.
For media coverage of this issue, see, for example:
Erasmus, D. (2010). Historic farming community under threat. Farmer’s Weekly, 1 November.
Swart, H. (2012). Fight for Philippi: Cape farmland could lose ground to housing. Mail & Guardian, 16 November.
[4] For a closer look at the nature and effects of flooding in informal settlements in Philippi, see these two articles:
Drivdal, L. (2013). Flooding in the informal settlement of Egoli, Cape Town. weADAPT, 12 June.
Drivdal, L. (2013). Flooding in the informal settlement of Graveyard Pond, Cape Town. weADAPT, 12 June.
To see another application of the step-by-step climate guidance, this time in Bagamoyo, Tanzania, please click here.
(0) Comments
There is no content