Wellbeing Surveys

This tool is part of the SEI Urban Toolbox for Liveable Cities which has been developed by the SEI Initiative on City Health and Wellbeing.The Urban Toolbox is a collection of tools, developed within SEI or in coordination with SEI, aimed at supporting planning and decision-making for improving the health, well-being and resilience of city residents and urban systems more broadly.
GO TO THE SEI URBAN TOOLBOX FOR LIVEABLE CITIES HOMEPAGE
About these tools
To ensure future sustainability, cities need to consider concepts of livability and resident wellbeing alongside environmental, economic and infrastructure development equity. Assessments of both subjective and objective wellbeing can be undertaken using a range of existing tools, including:the Short Warwick Edinburgh Mental Wellbeing Scale (SWEMWBS) which uses a Likert scale to explore subjective wellbeing; the Perceived Stress Scale (PSS), which measures sub-chronic stress; the University of Wales Institute of Science and Technology (UWIST) Mood Adjective Checklist (MACL), which can be used to determine acute subjective mood changes; and technologies, such as mobile electroencephalography, that can measure physiological changes.
*This Urban Toolbox article borrows some text from the OECD discussion paper (2013) and the following scientific papers:
- “Assessing Inequalities in Wellbeing at a Neighbourhood Scale in Low-Middle-Income-Country Secondary Cities and Their Implications for Long-Term Livability” published in Frontiers of Sociology, 6(729453), under theCC BY 4.0 license in November 2021 © Cinderby et al.
- “Understanding psychophysiological responses to walking in urban settings in Asia and Africa” published in Journal of Environmental Psychology, 86, under the CC BY-NC-ND license in March 2023 © Neale et al.
- “The impact of walking in different urban environments on brain activity in older people” published in Cities and Health, 4(1), under the CC BY 4.0 license in June 2019 © Neale et al.
Please note that references have been removed.For more detail, full references, and to quote text please use the OECD paper available for download on the right and the scientific papers listed in the further resources section at the end of the page.
How do the tools work?
The wellbeing surveys and tools are completed and used by a chosen sample of participants (e.g. purposive, representative) to better understand and assess their levels of health and wellbeing. Often the surveys are designed to be self-completed and are available either digitally or on paper. Depending on the type of survey implemented, answers may be translated into numerical scores which can then be summed and analysed to identify the overall wellbeing of an individual, group of respondents, or region. For technologies, such as the Huwei Watch 2 wearable devices that monitor heart rate variability, numerical data is generated and analysed.
Who might use the tools?
Researchers interested in health and wellbeing; urban planners; health practitioners; students.
Which stakeholders are involved?
A group of citizens that are either representative of a larger population (e.g. national, regional or local scale) or belonging to a particular group of interest to those conducting the surveys.
What stage of the process do these tools support?
- Identifying problem areas and solutions
- Generating ideas and knowledge
- Monitoring and evaluation
Tool overview
With the global transition to urban living, cities need to become sustainable in the broadest sense, which increasingly includes concepts of wellbeing and quality of life alongside environmental and economic considerations. The inclusion of considerations of wellbeing in urban sustainability entails that residents should not only live in a clean, safe and healthy spaces but should also have equity of opportunity to act and move around in health-promoting environments.
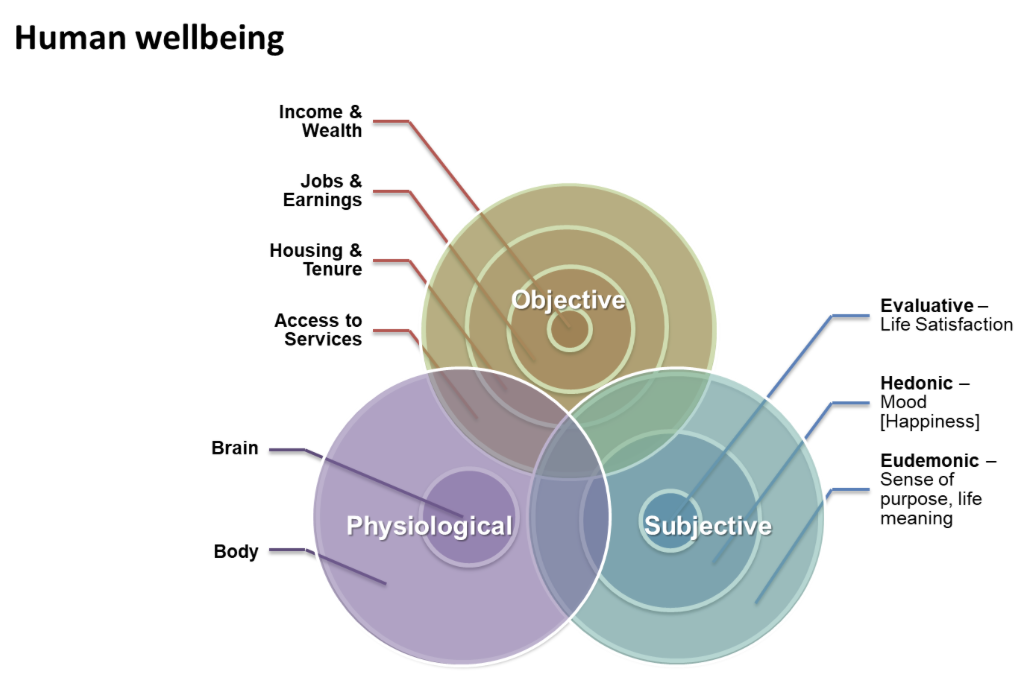
Wellbeing can be considered a key component for a person’s quality of life and encapsulates objective, subjective and physiological elements:
- The objective dimensions define wellbeing in terms of quality-of-life indicators including access to basic needs resources (e.g. food, housing, income) and social attributes (education, health, political voice, social networks). Objective datacan be used to assess objectively verifiable achievements in respect to both the material conditions (e.g. income and wealth; jobs and earnings; housing) and the quality of life (e.g. health status; education and skills; social connections) dimensions.
- The subjective dimension emphasizes people’s own life evaluations including satisfaction (a cognitive evaluation) and happiness (relative emotional state). Subjective wellbeing encompasses hedonic functions such as pleasure attainment and pain avoidance, and eudemonic linked to a meaningful existence related to personal functioning (within individuals own mental and physical constraints). Subjective data assesses people’s satisfaction with their achievements forall of thequality of life componentsand also for the quality of their achievements in material conditions. For example, a person may have a job and earn a salary but view this as inadequate for living to the standard to which they aspire in that particular social and geographical context.
- The physiological dimension focuses on the human body and brain. It encompasses aspects such as neural activity, physical responses to stress e.g. heart rate variability, and body temperature.
An introduction to different wellbeing measurement tools:
- The Short Warwick Edinburgh Mental Wellbeing Scale (SWEMWBS) = this survey assesses subjective wellbeing through seven questions rated on a five-point Likert scale which have been validated for construct validity. The scale has revealed national wellbeing averages in the UK (McFall and Garrington, 2011) and has successfully been used in Europe (Koushede et al., 2019), Asia and Africa (Neale et al., 2019). This scale asks respondents to consider dimensions of life related to their wellbeing over the past 4 weeks. Higher scores on SWEMWBS represent higher wellbeing (which is beneficial). Further information on SWEMWBS, and details about obtaining rights to use it, can be accessed online.
- The Perceived Stress Scale (PSS) = this is a measure of sub-chronic stress (Cohen, 1983) which evaluates subjective levels of stress over the previous 2 weeks. Survey questions were designed to measure how unpredictable, uncontrollable, or overloaded respondents find their lives. Higher scores on the PSS refer to higher stress, which is problematic and could have significant implications for a respondent’s overall health and wellbeing.
- The University of Wales Institute of Science and Technology (UWIST) Mood Adjective Checklist (MACL) = this is a 24-item checklist that gives an acute psychometric measure of hedonic tone (valence), stress and (physical) arousal, shown as three scores. Respondents are required to complete the questionnaire before and soon after completion of activity to ensure measurement of momentary shifts in mood. The arousal scale measures feelings of subjective energy. The stress scale measures feelings of subjective tension and the hedonic tone scale measures overall pleasantness of mood and is associated with feelings of somatic comfort and wellbeing. Scores are obtained from summation of individual item scores pertaining to each of the three mood components.
- Surveys to assess objective wellbeing = these can include questions on the impact of different environmental and social factors on a respondent’s wellbeing. E.g. a recent SEI study looked at the impact of 11 different factors. The impacts ranged from large (scored 1) to no impact (4) on a forced four-point Likert scale. The participant’s response scores across the eleven variables can then be summed to create a composite indicator of objective wellbeing. Explore this approach further in the case study section.
- Assessments of urban infrastructure on wellbeing = these can be used to evaluate the impact of urban infrastructure availability and use on wellbeing. E.g. a recent SEI study used 2 data sources: (1) participants’ responses to questions on accessibility (e.g. do you live within walking distance of x ) and how much time they spend in these areas of greenspace and built public realm spaces (how many hours do you spend in these spaces (both within and beyond walking distance)) ; and (2) satellite imagery pre-processed was used to quantify greenspace and indicate mean normalised difference vegetation index (NDVI) values. Explore this approach further in the case study section.
- Tools to assess physio- and psychological wellbeing = these measure bodily and physical responses to the surrounding environment and environmental stressors. For example, Huwei Watch 2 wearable devices (a type of smart watch) can be worn by participants to measure their heart rate variability as they walk through urban settings. Another approach is to look at neurological activity, using technologies such as mobile electroencephalography, to understand the impact of urban environments (busy, quiet and green urban spaces) onbrain activity.
Application: Case studies on measuring wellbeing
Assessing Inequalities in Wellbeing at a Neighbourhood Scale in Nakuru, Kenya and Udon Thani, Thailand – explore how these surveys have been used to assess wellbeing in two low-middle income country cities and the implications of these findings for urban management and policy.
Capabilities and resources required
- Access to web-based technology if conducting surveys in a digital format (across your study sample).
- Trained individuals to recruit for, conduct or distribute the wellbeing surveys. This may be people from the study area, to overcome potential language barriers, and whom local communities trust.
- Statistical analysis capabilities to analyse subjective and objective wellbeing survey results, including identifying inequalities in wellbeing across cities.
- Access to complementary secondary data collected by city or national agencies that could affect wellbeing or reveal patterns of mental health issues. For secondary mental health data, this could include health surveys using the Self-Reporting Questionnaire-20 (SRQ-20) on common mental disorders or drug prescribing data that can identify patterns in the use of anti-depressant medications. For other factors affecting wellbeing, this could include crime distribution statistics, air pollution data, road safety data, distribution of green space, and distribution of communal facilities such as health care facilities.
Implementation tips: key enablers and potential barriers
Aspects to consider when implementing the different tools and surveys:
- It is important to make the surveys available in the languages appropriate to your sample of participants. However, also note that the surveys have been developed in a western context, and thus implementing them in different cultural contexts may alter the meanings of words and increase the chance of the subtlety between different emotional states being lost (e.g. for the PSS survey). This may influence how individuals assess their own wellbeing, mood, and health. Co-producing and co-designing surveys with people local to your study area(s) may be a way to overcome this barrier.
- Linking to this, wellbeing itself has different meanings across cultures and contexts. For example, its connection to the natural environment may be minimal or not considered important for some groups of people. Thus, it is important to consider perceptions around wellbeing as a term, and the implications this could have on your results – particularly if you are surveying a larger, more culturally diverse population.
- Urban areas and the communities that reside in them are dynamic, so using these tools in a long-term longitudinal approach may create a more accurate picture of wellbeing.
- If the wellbeing survey you implement requires participants to answer the same questions in different geographical areas, it might be important to consider how to best maintain their interest (particularly if they are not accustomed to the concept of wellbeing). For example, refining or limiting the spatial scale of the study.
- Combining the quantitative data obtained from surveys with more qualitative data (e.g. interviews, focus groups) may add richness and context to the findings.
- There may be trade-offs between the aspects that most contribute to a positive health and wellbeing, and the most cost-effective health interventions in a region.
Potential integration with other tools
As well as integrating subjective, objective and physiological measurements of wellbeing to obtain a holistic perspective, assessments can also be connected to approaches that focus on other environmental conditions that have the potential to affect human wellbeing. For example, access to green and blue space; noise and air pollution; water quality etc.
Suggested Citations:
OECD. (2013). Discussion Paper for Session 3.1: Measuring well-being for development. OECD publishing: https://www.oecd.org/site/oecdgfd/Session%203.1%20-%20GFD%20Background%20Paper.pdf.
Cinderby S, Archer D, Mehta VK, Neale C, Opiyo R, Pateman RM, Muhoza C, Adelina C and Tuhkanen H (2021) Assessing Inequalities in Wellbeing at a Neighbourhood Scale in Low-Middle-Income-Country Secondary Cities and Their Implications for Long-Term Livability.Front. Sociol. 6:729453. doi: 10.3389/fsoc.2021.729453
Neale, C., Aspinall, P., Roe, J., Tilley, S., Mavros, P., Cinderby, S., Coyne, R., Thin, N. & Ward Thompson, C.(2020)The impact of walking in different urban environments on brain activity in older people,Cities & Health,4:1,94-106,DOI: 10.1080/23748834.2019.1619893
Neale, C., Boukhechba, M. and Cinderby, S. (2023) Understanding psychophysiological responses to walking in urban settings in Asia and Africa, Journal of Environmental Psychology, 86,https://doi.org/10.1016/j.jenvp.2023.101973.
Related resources
- Assessing Inequalities in Wellbeing at a Neighbourhood Scale in Nakuru, Kenya and Udon Thani, Thailand
- MapStakes: A tool for co-creation processes
- Empowerment in WASH Index Tool
- Using EWI to inform the implementation of a WASH master plan in the municipality of Banfora, Burkina Faso
- Using EWI to strengthen gender dimensions in Asutifi North District WASH master plan, Ghana
(0) Comments
There is no content