Climate Analysis – Tanzania
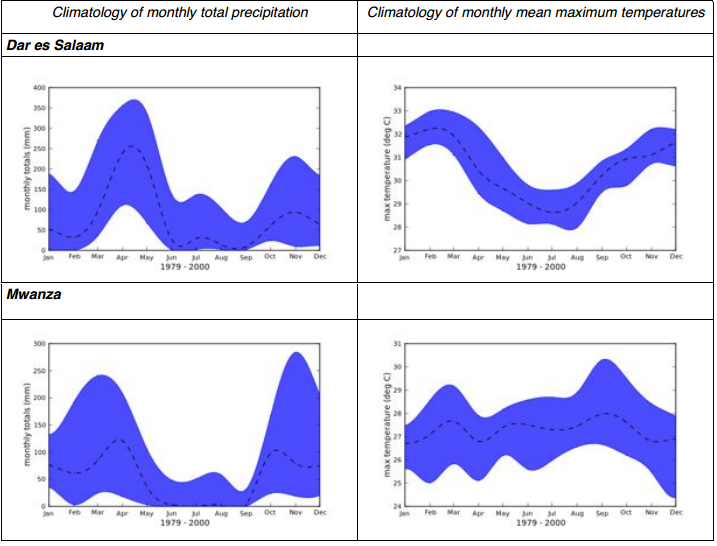
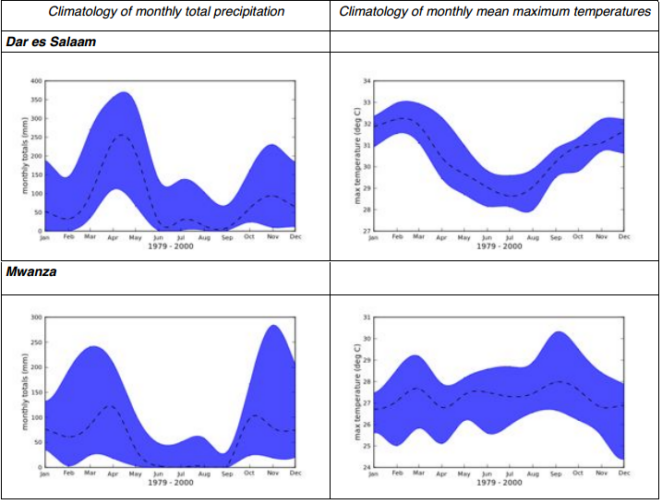
The graphics show observed rainfall (monthly totals) and maximum temperature (monthly mean) for selected stations between 1979 and 2000. The blue envelope represents the range between the 10th and the 90th percentile values for each month. The dashed line represents the median value for each month.
Background
This analysis of observed (i.e. historical) and projected future climate for Tanzania forms part of the Economics of Climate Change in Tanzania project.
It is always important to consider current climate inter-annual variability when one investigates the climate of a region. This gives an indication of the range of variability currently being experienced, which is critical when one considers additional changes projected for the future. It is often the case that the current inter-annual variability of precipitation (i.e. the range between years) is very large compared to future projected changes, particularly for the near future (50 years). This is an important consideration for end users, depending on the sector and the type of vulnerability in question.
Tanzania’s climate is largely dictated by the movement of the ITCZ; the movement and ‘splitting’ causes many areas of Tanzania to experience a double rain season, with Dar es Salaam and Mwanza being the most prominent examples of this due to their proximity to large water bodies (the Indian Ocean and Lake Victoria). These water bodies also contribute to the smoothing out of annual temperature variation, which is especially notable in Mwanza.
Observed climatologies of temperature show a seasonal cycle. Most locations have a fairly small seasonal temperature variation of around 3°C to 4°C, which is not uncommon in tropical areas. Kilimanjaro International Airport shows the strongest cycle which is most likely related to it’s altitude. Mwanza is unique in having a fairly constant temperature through the year but this is most likely a result of the lake proximity, which would strongly moderate the temperature in the vicinity.
Projections
The analysis of observed and future projections has been conducted using the Climate Information Portal CIP, which presents statistically downscaled climate projections based on the SRES emissions scenario (IPCC, 2007) at the station level. The CMIP3 archive GCMs are used in this study (Climate Model Intercomparison Project).
The downscaling methodology requires daily archive fields which limited the number of suitable GCMs to a total of 9 out of a possible 21. See the full report for more details.
Precipitation
Future changes in precipitation are uncertain, but there are some indications of wetting for many locations, which will be concentrated during the late summer, but will also be apparent for some places at the beginning of the summer season.
Such changes are indicative of a seasonal shift with weaker early season rains and stronger later season rains. Interestingly the far future projections (2081-2100) do not show significant wetting compared to the near future projections (2046-2065) suggesting that some limit on precipitation may be reached.
Temperature
Depending on different emission scenarios, we can expect to see between 1.5°C and 2.0°C warming by the period 2046-2065, and between 2.0°C and 4°C by the end of the century. These figures, generated by GCM’s (Global Climate Models), are comparable with, but slightly lower than, regional figures. This is likely due to the forcing behaviours of the fluvial and topographical features of Tanzania. Cooling degree days (CDDs) though, show consistent increases across the region. The largest anomalies of projected future temperature can be seen in the winter periods due to the seasonal variability associated with increasing humidity in the short-term future. Longer term projections (2081-2100) indicate less of an affect by atmospheric moisture content because of the likelihood of the relationship between humidity and temperature rise to have reached an equilibrium. Accordingly, long-term temperature anomalies are expected to be more constant.
(0) Comments
There is no content