Methodology of Bhutan NCAP Project
Overview of the methodology
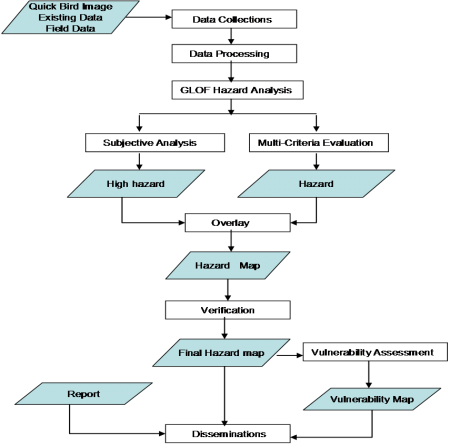
An overview of the methodology used in the preparation of hazard maps is shown in the above figure. The whole process of the preparation of the hazard maps was kept very simple but all the technical aspects required were incorporated. Each of the steps followed in the above figure are explained in detail in the following section. For the purpose of data analysis and hazard map production the following materials were used:
- Topographical maps Topographical maps for most of the areas where accessible and critical were prepared using surveying instruments (“Total Station”). The close contours generated were then used for the data analysis. For those parts where the accessibility was not possible, the contours generated from the SRTM were used. In fact the slope which forms one of the important aspects in the data analysis part was generated using these contours.
- Satellite images Given the importance of the project, a set of Quick Bird images were procured which have a resolution of 0.6m.
- Land use maps These maps were prepared in the field based on the field verification and using the satellite images as base material.
- Material maps These maps were also prepared in the field based on the field verification and using the satellite images as base material.
- Slope maps For the areas which were accessible and critical, surveys were conducted using “Total Station” and contours generated from this were then used to generate the slope maps. For those areas where it was inaccessible for the team to conduct surveys, SRTM was used to generate contours and based on these contours slope maps were prepared.
- Socio-economic information All this information was collected in the field through interaction with the local vulnerable com- munities. The information covers a wide range of aspects which are listed below. This information was mainly collected to assess the vulnerability of the local communities should a GLOF occur in the Puna Tsang Chu basin.
Spatial data analysis (GLOF hazard analysis)
In this project, the GLOF hazard analysis was carried out using a GIS based multi-criteria evaluation. Multi-criteria evaluation is primarily concerned with how to combine the information from several criteria to form a single index of evaluation. In the case of Boolean criteria, the solution usually lies in the union (logical OR) or intersection (logical AND) of conditions. However, for continuous factors, a weighted linear combination (Voogd, 1983) is a usual technique. As the criteria are measured on different scales, they are standardized and transformed such that all factor maps are positively correlated with floods. Many decisions depend on identifying relevant factors (criteria) and adding their appropriately weighted value. Each expert in a decision or in the process of weighting criteria will have their own assessment of it based on their knowledge and experiences.
An ArcGIS Model Builder, commercial GIS software produced by ESRI has been used for this project of a GLOF analysis. A multi-criteria evaluation can be approached from two methods: a) binary method and b) weighted overlay method.
Field Verification
Once our results are obtained from any spatial analysis, it is essential that they are verified. After the completion of hazard analysis, a team comprising a Glaciologist, Geologist, Geo-Informatics officer and survey assistant went into the field to carry out the field verification on the ground. The population and infrastructure data, land use/land cover, material type, terrace height and horizontal distance from the river centre were taken into account during ground verification. Not only were these taken into account, but also the historical data of GLOF events in the past particularly the 1994 GLOF and the information collected regarding the past GLOFs from the people. It was found that the results obtained were as good as could be expected.
Sensitivity Analysis
This is a discipline that plays a key role in the scientific modeling. It is the study of how the variations in the output of a model are apportioned qualitatively or quantitatively to different sources of variation of a model. The number of input factors involved in the analysis and objectives of the model play a major role in determining the final result. A sensitivity analysis on a model is to identify a parameter which has a substantial impact on a final result. A model which was created for suitability for mining area in Bhutan was run to evaluate the impact of parameters. Sensitivity analysis depends on the error in the input data as criterion weights and criterion attributes. The impact of parameters on the final results was tested using sensitivity analysis and it was found that both land use and material had equal influence.
Further methodological details can be found in the final report.
Next. . .
Back to:
Netherlands Climate Assistance Programme (NCAP)
On to:
Key findings from Bhutan NCAP Project
Conclusions of Bhutan NCAP Project
Related Pages
Key findings from Bhutan NCAP Project
(0) Comments
There is no content