Can the Warming of the 20th Century be Explained by Natural Variability?
Please note that this material is from the Fourth Assessment Report of the Intergovernmental Panel on Climate Change (IPCC), published in 2007. The latest climate science can be found inthe IPCC’s 6th Assessment Report, published in August 2021. For other reports and further updates, please refer to theIPCC website.
This material is extracted from the Frequently Asked Questions (FAQs) section of the Fourth Assessment Report of the Intergovernmental Panel on Climate Change (IPCC), Working Group 1 (see full reference below).
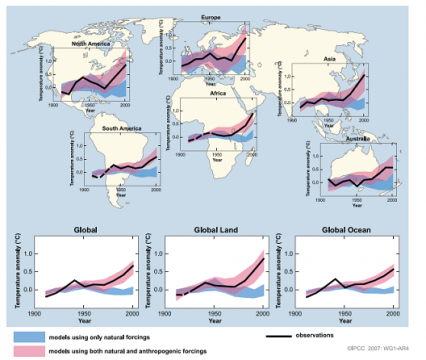
It is very unlikely that the 20th-century warming can be explained by natural causes. The late 20th century has been unusually warm. Palaeoclimatic reconstructions show that the second half of the 20th century was likely the warmest 50-year period in the Northern Hemisphere in the last 1300 years. This rapid warming is consistent with the scientific understanding of how the climate should respond to a rapid increase in greenhouse gases like that which has occurred over the past century, and the warming is inconsistent with the scientific understanding of how the climate should respond to natural external factors such as variability in solar output and volcanic activity. Climate models provide a suitable tool to study the various influences on the Earth’s climate. When the effects of increasing levels of greenhouse gases are included in the models, as well as natural external factors, the models produce good simulations of the warming that has occurred over the past century. The models fail to reproduce the observed warming when run using only natural factors. When human factors are included, the models also simulate a geographic pattern of temperature change around the globe similar to that which has occurred in recent decades. This spatial pattern, which has features such as a greater warming at high northern latitudes, differs from the most important patterns of natural climate variability that are associated with internal climate processes, such as El Niño.
FAQ 9.2, Figure 1. Temperature changes relative to the corresponding average for 1901-1950 (°C) from decade to decade from 1906 to 2005 over the Earth’s continents, as well as the entire globe, global land area and the global ocean (lower graphs). The black line indicates observed temperature change, while the coloured bands show the combined range covered by 90% of recent model simulations. Red indicates simulations that include natural and human factors, while blue indicates simulations that include only natural factors. Dashed black lines indicate decades and continental regions for which there are substantially fewer observations.
Reference
IPCC, 2007: Climate Change 2007: The Physical Science Basis. Contribution of Working Group I to the Fourth Assessment, Report of the Intergovernment Panel on Climate Change [Solomon, S., D. Qin, M. Manning, Z. Chen, M. Marquis, K.B. Averyt, M.Tignor and H.L. Miller (eds.)]. Cambridge University Press, Cambridge, United Kingdom and New York, NY, USA.
For a more detailed explanation of the answer please see the original IPCC FAQ document at:http://www.ipcc.ch/pdf/assessment-report/ar4/wg1/ar4-wg1-faqs.pdf
(0) Comments
There is no content