Can Individual Extreme Events be Explained by Greenhouse Warming?
Please note that this material is from the Fourth Assessment Report of the Intergovernmental Panel on Climate Change (IPCC), published in 2007. The latest climate science can be found inthe IPCC’s 6th Assessment Report, published in August 2021. For other reports and further updates, please refer to theIPCC website.
This material is extracted from the Frequently Asked Questions (FAQs) section of the Fourth Assessment Report of the Intergovernmental Panel on Climate Change (IPCC), Working Group 1 (see full reference below).
Changes in climate extremes are expected as the climate warms in response to increasing atmospheric greenhouse gases resulting from human activities, such as the use of fossil fuels. However, determining whether a specific, single extreme event is due to a specific cause, such as increasing greenhouse gases, is difficult, if not impossible, for two reasons: 1) extreme events are usually caused by a combination of factors and 2) a wide range of extreme events is a normal occurrence even in an unchanging climate. Nevertheless, analysis of the warming observed over the past century suggests that the likelihood of some extreme events, such as heat waves, has increased due to greenhouse warming, and that the likelihood of others, such as frost or extremely cold nights, has decreased. For example, a recent study estimates that human influences have more than doubled the risk of a very hot European summer like that of 2003.
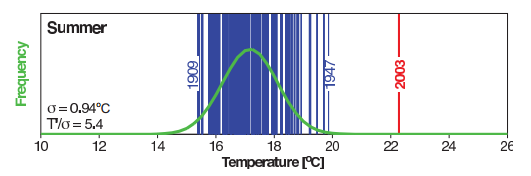
FAQ 9.1, Figure 1. Summer temperatures in Switzerland from 1864 to 2003 are, on average, about 17°C, as shown by the green curve. During the extremely hot summer of 2003, average temperatures exceeded 22°C, as indicated by the red bar (a vertical line is shown for each year in the 137-year record). The fitted Gaussian distribution is indicated in green. The years 1909, 1947 and 2003 are labelled because they represent extreme years in the record. The values in the lower left corner indicate the standard deviation (σ) and the 2003 anomaly normalised by the 1864 to 2000 standard deviation (T’/σ). From Schär et al. (2004).
Reference
IPCC, 2007: Climate Change 2007: The Physical Science Basis. Contribution of Working Group I to the Fourth Assessment, Report of the Intergovernment Panel on Climate Change [Solomon, S., D. Qin, M. Manning, Z. Chen, M. Marquis, K.B. Averyt, M.Tignor and H.L. Miller (eds.)]. Cambridge University Press, Cambridge, United Kingdom and New York, NY, USA.
For a more detailed explanation of the answer please see the original IPCC FAQ document at:http://www.ipcc.ch/pdf/assessment-report/ar4/wg1/ar4-wg1-faqs.pdf
(0) Comments
There is no content