Are the Increases in Atmospheric Carbon Dioxide and Other Greenhouse Gases During the Industrial Era Caused by Human Activities?
Please note that this material is from the Fourth Assessment Report of the Intergovernmental Panel on Climate Change (IPCC), published in 2007. The latest climate science can be found inthe IPCC’s 6th Assessment Report, published in August 2021. For other reports and further updates, please refer to theIPCC website.
This material is extracted from the Frequently Asked Questions (FAQs) section of the Fourth Assessment Report of the Intergovernmental Panel on Climate Change (IPCC), Working Group 1 (see full reference below).
Yes, the increases in atmospheric carbon dioxide (CO2) and other greenhouse gases during the industrial era are caused by human activities. In fact, the observed increase in atmospheric CO2 concentrations does not reveal the full extent of human emissions in that it accounts for only 55% of the CO2 released by human activity since 1959. The rest has been taken up by plants on land and by the oceans. In all cases, atmospheric concentrations of greenhouse gases, and their increases, are determined by the balance between sources (emissions of the gas from human activities and natural systems) and sinks (the removal of the gas from the atmosphere by conversion to a different chemical compound). Fossil fuel combustion (plus a smaller contribution from cement manufacture) is responsible for more than 75% of human-caused CO2 emissions. Land use change (primarily deforestation) is responsible for the remainder. For methane, another important greenhouse gas, emissions generated by human activities exceeded natural emissions over the last 25 years. For nitrous oxide, emissions generated by human activities are equal to natural emissions to the atmosphere. Most of the long-lived halogen-containing gases (such as chlorofluorcarbons) are manufactured by humans, and were not present in the atmosphere before the industrial era. On average, present-day tropospheric ozone has increased 38% since pre-industrial times, and the increase results from atmospheric reactions of short-lived pollutants emitted by human activity. The concentration of CO2 is now 379 parts per million (ppm) and methane is greater than 1,774 parts per billion (ppb), both very likely much higher than any time in at least 650 kyr (during which CO2 remained between 180 and 300 ppm and methane between 320 and 790 ppb). The recent rate of change is dramatic and unprecedented; increases in CO2 never exceeded 30 ppm in 1 kyr – yet now CO2 has risen by 30 ppm in just the last 17 years.
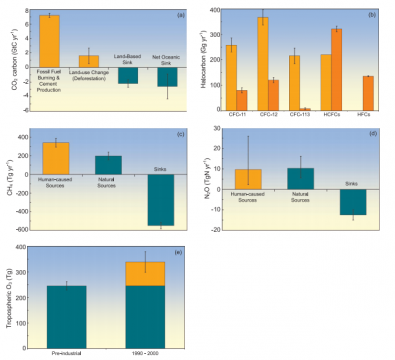
FAQ 7.1, Figure 1. Breakdown of contributions to the changes in atmospheric greenhouse gas concentrations, based on information detailed in Chapters 4 and 7. In (a) through (d), human-caused sources are shown in orange, while natural sources and sinks are shown in teal. In (e), human-caused tropospheric ozone amounts are in orange while natural ozone amounts are in green. (a) Sources and sinks of CO2 (GtC). Each year CO2 is released to the atmosphere from human activities including fossil fuel combustion and land use change. Only 57 to 60% of the CO2 emitted from human activity remains in the atmosphere. Some is dissolved into the oceans and some is incorporated into plants as they grow. Land-related fluxes are for the 1990s; fossil fuel and cement fluxes and net ocean uptake are for the period 2000 to 2005. All values and uncertainty ranges are from Table 7.1. (b) Global emissions of CFCs and other halogen-containing compounds for 1990 (light orange) and 2002 (dark orange). These chemicals are exclusively human-produced. Here, ‘HCFCs’ comprise HCFC-22, -141b and -142b, while ‘HFCs’ comprise HFC-23, -125, -134a and -152a. One Gg = 10 9 g (1,000 tonnes). Most data are from reports listed in Chapter 2. (c) Sources and sinks of CH4 for the period 1983 to 2004. Human-caused sources of CH4 include energy production, landfills, ruminant animals (e.g., cattle and sheep), rice agriculture and biomass burning. One Tg = 10 12 g (1 million tonnes). Values and uncertainties are the means and standard deviations for CH4 of the corresponding aggregate values from Table 7.6. (d) Sources and sinks of N2 O. Human-caused sources of N2 O include the transformation of fertilizer nitrogen into N2 O and its subsequent emission from agricultural soils, biomass burning, cattle and some industrial activities including nylon manufacture. Source values and uncertainties are the midpoints and range limits from Table 7.7. N2 O losses are from Chapter 7.4. (e) Tropospheric ozone in the 19th and early 20th centuries and the 1990 to 2000 period. The increase in tropospheric ozone formation is human-induced, resulting from atmospheric chemical reactions of pollutants emitted by burning of fossil fuels or biofuels. The pre-industrial value and uncertainty range are from Table 4.9 of the IPCC Third Assessment Report (TAR), estimated from reconstructed observations. The present-day total and its uncertainty range are the average and standard deviation of model results quoted in Table 7.9 of this report, excluding those from the TAR.
Reference
IPCC, 2007: Climate Change 2007: The Physical Science Basis. Contribution of Working Group I to the Fourth Assessment, Report of the Intergovernment Panel on Climate Change [Solomon, S., D. Qin, M. Manning, Z. Chen, M. Marquis, K.B. Averyt, M.Tignor and H.L. Miller (eds.)]. Cambridge University Press, Cambridge, United Kingdom and New York, NY, USA.
For a more detailed explanation of the answer please see the original IPCC FAQ document at:http://www.ipcc.ch/pdf/assessment-report/ar4/wg1/ar4-wg1-faqs.pdf
(0) Comments
There is no content