How is Precipitation Changing?
Please note that this material is from the Fourth Assessment Report of the Intergovernmental Panel on Climate Change (IPCC), published in 2007. The latest climate science can be found inthe IPCC’s 6th Assessment Report, published in August 2021. For other reports and further updates, please refer to theIPCC website.
This material is extracted from the Frequently Asked Questions (FAQs) section of the Fourth Assessment Report of the Intergovernmental Panel on Climate Change (IPCC), Working Group 1 (see full reference below).
Observations show that changes are occurring in the amount, intensity, frequency and type of precipitation. These aspects of precipitation generally exhibit large natural variability, and El Niño and changes in atmospheric circulation patterns such as the North Atlantic Oscillation have a substantial influence. Pronounced longterm trends from 1900 to 2005 have been observed in precipitation amount in some places: significantly wetter in eastern North and South America, northern Europe and northern and central Asia, but drier in the Sahel, southern Africa, the Mediterranean and southern Asia. More precipitation now falls as rain rather than snow in northern regions. Widespread increases in heavy precipitation events have been observed, even in places where total amounts have decreased. These changes are associated with increased water vapour in the atmosphere arising from the warming of the world’s oceans, especially at lower latitudes. There are also increases in some regions in the occurrences of both droughts and floods.
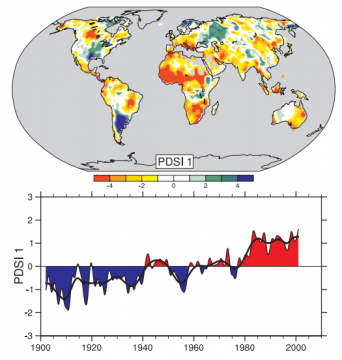
FAQ 3.2, Figure 1. The most important spatial pattern (top) of the monthly Palmer Drought Severity Index (PDSI) for 1900 to 2002. The PDSI is a prominent index of drought and measures the cumulative deficit (relative to local mean conditions) in surface land moisture by incorporating previous precipitation and estimates of moisture drawn into the atmosphere (based on atmospheric temperatures) into a hydrological accounting system. The lower panel shows how the sign and strength of this pattern has changed since 1900. Red and orange areas are drier (wetter) than average and blue and green areas are wetter (drier) than average when the values shown in the lower plot are positive (negative). The smooth black curve shows decadal variations. The time series approximately corresponds to a trend, and this pattern and its variations account for 67% of the linear trend of PDSI from 1900 to 2002 over the global land area. It therefore features widespread increasing African drought, especially in the Sahel, for instance. Note also the wetter areas, especially in eastern North and South America and northern Eurasia. Adapted from Dai et al. (2004b).
Reference
IPCC, 2007: Climate Change 2007: The Physical Science Basis. Contribution of Working Group I to the Fourth Assessment, Report of the Intergovernment Panel on Climate Change [Solomon, S., D. Qin, M. Manning, Z. Chen, M. Marquis, K.B. Averyt, M.Tignor and H.L. Miller (eds.)]. Cambridge University Press, Cambridge, United Kingdom and New York, NY, USA.
For a more detailed explanation of the answer please see the original IPCC FAQ document at:http://www.ipcc.ch/pdf/assessment-report/ar4/wg1/ar4-wg1-faqs.pdf
(0) Comments
There is no content