How are Temperatures on Earth Changing?
Please note that this material is from the Fourth Assessment Report of the Intergovernmental Panel on Climate Change (IPCC), published in 2007. The latest climate science can be found inthe IPCC’s 6th Assessment Report, published in August 2021. For other reports and further updates, please refer to theIPCC website.
This material is extracted from the Frequently Asked Questions (FAQs) section of the Fourth Assessment Report of the Intergovernmental Panel on Climate Change (IPCC), Working Group 1 (see full reference below).
Instrumental observations over the past 157 years show that temperatures at the surface have risen globally, with important regional variations. For the global average, warming in the last century has occurred in two phases, from the 1910s to the 1940s (0.35°C), and more strongly from the 1970s to the present (0.55°C). An increasing rate of warming has taken place over the last 25 years, and 11 of the 12 warmest years on record have occurred in the past 12 years. Above the surface, global observations since the late 1950s show that the troposphere (up to about 10 km) has warmed at a slightly greater rate than the surface, while the stratosphere (about 10–30 km) has cooled markedly since 1979. This is in accord with physical expectations and most model results. Confirmation of global warming comes from warming of the oceans, rising sea levels, glaciers melting, sea ice retreating in the Arctic and diminished snow cover in the Northern Hemisphere.
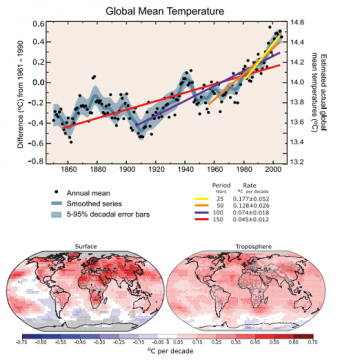
FAQ 3.1, Figure 1. (Top) Annual global mean observed temperatures 1 (black dots) along with simple fits to the data. The left hand axis shows anomalies relative to the 1961 to 1990 average and the right hand axis shows the estimated actual temperature (°C). Linear trend fits to the last 25 (yellow), 50 (orange), 100 (purple) and 150 years (red) are shown, and correspond to 1981 to 2005, 1956 to 2005, 1906 to 2005, and 1856 to 2005, respectively. Note that for shorter recent periods, the slope is greater, indicating accelerated warming. The blue curve is a smoothed depiction to capture the decadal variations. To give an idea of whether the fluctuations are meaningful, decadal 5% to 95% (light blue) error ranges about that line are given (accordingly, annual values do exceed those limits). Results from climate models driven by estimated radiative forcings for the 20th century (Chapter 9) suggest that there was little change prior to about 1915, and that a substantial fraction of the early 20th-century change was contributed by naturally occurring influences including solar radiation changes, volcanism and natural variability. From about 1940 to 1970 the increasing industrialisation following World War II increased pollution in the Northern Hemisphere, contributing to cooling, and increases in carbon dioxide and other greenhouse gases dominate the observed warming after the mid-1970s. (Bottom) Patterns of linear global temperature trends from 1979 to 2005 estimated at the surface (left), and for the troposphere (right) from the surface to about 10 km altitude, from satellite records. Grey areas indicate incomplete data. Note the more spatially uniform warming in the satellite tropospheric record while the surface temperature changes more clearly relate to land and ocean.
Reference
IPCC, 2007: Climate Change 2007: The Physical Science Basis. Contribution of Working Group I to the Fourth Assessment, Report of the Intergovernment Panel on Climate Change [Solomon, S., D. Qin, M. Manning, Z. Chen, M. Marquis, K.B. Averyt, M.Tignor and H.L. Miller (eds.)]. Cambridge University Press, Cambridge, United Kingdom and New York, NY, USA.
For a more detailed explanation of the answer please see the original IPCC FAQ document at:http://www.ipcc.ch/pdf/assessment-report/ar4/wg1/ar4-wg1-faqs.pdf
(0) Comments
There is no content