How to understand and interpret global climate model results
Introduction
Climate modelling approaches projecting future changes to the Earth’s climate vary widely, generating different types of dataset. These results are often displayed visually in a variety of formats, such as statistical graphs, maps and increasingly innovative presentations.
This guide*explains why there are so many climate model results, and how to interpret the various ways in which they are presented, in order to understand what models tell us about likely future climate. It is targeted primarily at technical staff in the government and non-government sectors, to offer an introduction to what can be a confusing and highly technical subject area.
*Download the full guide from the right-hand column.
Summary
The guide provides a detailed overview of the most important characteristics of climate models, the way in which they are presented (with multiple examples) and how to interpret their results. Briefly, the key areas covered are:
- What are global and regional climate models?
- Processing and summarising model results
- Understanding model datasets
- Presenting model data
- What to remember about climate models[see below]
- Time series graphs
- Maps
- Innovative presentation of GCM data for non-scientific audiences
Key messages from the report (summarised)
- Global climate models (GCMs) are widely used to understand what the climate may be like in the future. Because they work at a global scale, the resolution of GCM results is typically quite coarse (each grid cell is roughly 200 × 200 km).
- Regional climate models (RCMs) are applied to smaller spatial areas to produce results with greater local detail. RCMs still rely on GCMs for input data and therefore are not necessarily more reliable or more accurate.
- Models project the extent of difference (or anomaly) of various climate parameters – typically temperature and rainfall – relative to the long-term average. For example, the time periods used in the CMIP5 models are generally 2016-2035 (for near term); 2046-2065 (for medium term); and 2081-2100 (for long term). They require technical skill to use.
- For any given time period and area, it is important to use projections from multiple GCMs to capture the range of results. Employing just one GCM output, or the average or median of a group of GCMs, can disguise important information.
- Time series graphs show variation in parameters such as temperature and rainfall, and can portray annual, seasonal or monthly values for the recent past and projecting into the future.
- Maps offer an excellent format for displaying spatial patterns of change. Multiple maps can be used to show patterns of change for different seasons, time periods and scenarios of greenhouse gas emissions. However, the amount of detail they can show is limited by the rather coarse resolution of GCMs.
- Innovative presentations of GCM data for non-scientific audiences typically provide greater context, not just showing what the change is, but also highlighting what impacts it may have.
In conclusion:
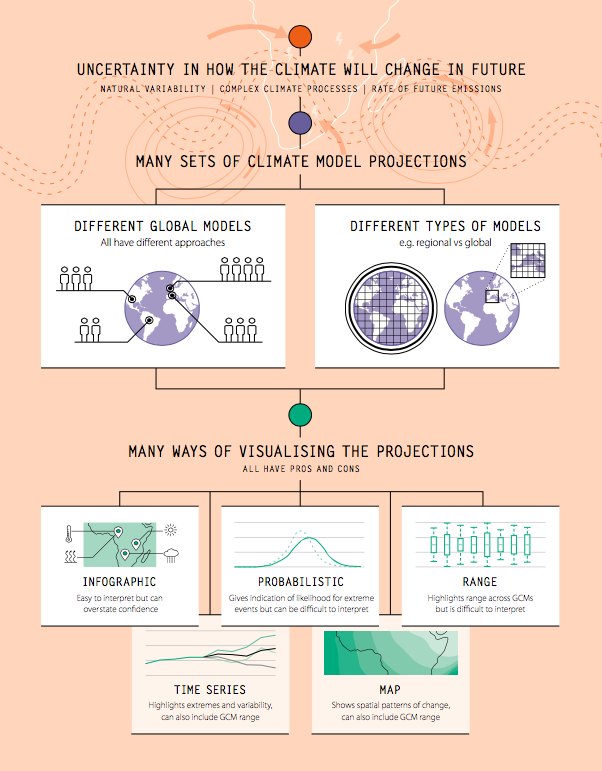
- There are a range of ways to present projections from climate models: graphs, maps, and innovative visual displays such as infographics, iconic figures and animations.
- Each approach has positives and negatives, and the choice of presentation should reflect the intended use of the information.
- This guide highlights what is being represented in different presentations to enable effective understanding and interpretation of GCM results.
What to remember about climate models
- Climate model results are not predictions or forecasts. Because of the uncertainties in GCM results, we refer to them as ‘projections’ (plausible descriptions of future climate).
- The rate at which greenhouse gases are emitted in the future can also lead to differences in climate model projections. Models are run under different scenarios in order to capture this. Higher emissions lead to faster rates of warming, but the differences are generally not very large until at least the 2050s.
- The inherent variability in the climate system (periods that are particularly warm or cool, or wet or dry) also leads to differences between GCM results.
- Climate model projections are not final. Models are constantly being refined as new understandings of the climate system come to light.
- All climate models show continued warming of surface air temperatures in the future. But for rainfall, which shows much greater variations across space and through time, there is less agreement between climate models. In some cases, the models do not even agree on whether a place will become drier or wetter.
- The reliability of model results generally decreases at finer scales. As we move from larger to smaller areas, the ability of climate models to represent local climatic influences decreases. Hence, although RCMs may produce projections with higher resolution, they are not necessarily more reliable.
- The differences between climate models and scientific uncertainties are often larger for less widely used climate parameters, such as wind speed, humidity and radiation (sunshine).
Suggested citation:
FCFA (2017). How to understand and interpret global climate model results. Future Climate for Africa.
Related resources
- Go to Future Climate For Africa's website
- Kulima Integrated Development Solutions
- Read the report "Africa's Climate: Helping decision-makers make sense of climate information"
- Read the report "The utility of weather and climate information for adaptation decision-making"
- Read the report "The Climate Knowledge Brokers Manifesto: Informed Decision Making for a Climate Resilient Future"
(0) Comments
There is no content