California Climate Data Guidance

Below is guidance on how to use the California climate data layer for Google Earth.
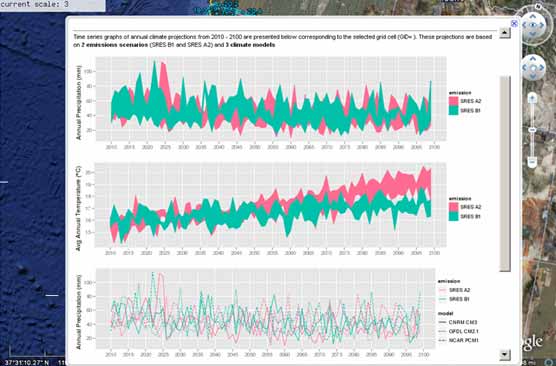
Clicking on any grid-center, dynamically generates time series graphs of 6 climate projections (from 3 climate models and 2 emissions scenarios).
Clicking on any grid-center, dynamically generates time series graphs of the data.
INTERMEDIATE SCALE (Tip! current scale=2 on top-left of viewport) The intermediate resolution grid (in green), is of 1/8th degree latitude-longitude resolution, the same resolution as the downscaled climate data. At this resolution only the climate data is provided, the other datasets being at too fine a resolution to aggregate meaningfully upto this scale.

Clicking on any grid-center, dynamically generates time series graphs of 6 climate projections (from 3 climate models and 2 emissions scenarios).

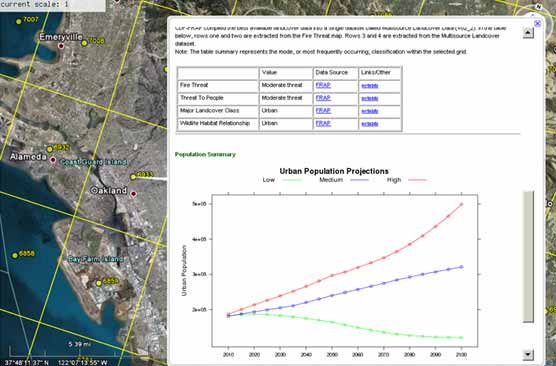
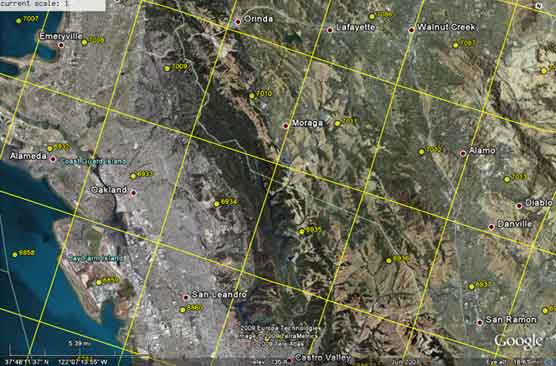
FINE SCALE (Tip! current scale=1 on top-left of viewport) At this resolution the following data is provided: Climate comparison and time series; most frequently occurring fire threat; landcover and habitat classifications; and urban population projections.
Clicking on any grid-center, dynamically generates time series graphs of the data.
(0) Comments
There is no content