Visualizing connections: Mapping the landscape of adaptation research and practice through weADAPT
Introduction
Information and communications technology (ICT) has transformative potential in several key areas in sustainable development, and is already facilitating multi-stakeholder engagement, knowledge exchange and capacity-building.
This paper*describes the Climate Actor Mapping for Adaptation (CAMA) project, which built on a collaboration with Sciences Po médialab in Paris, known for its innovative approach to “controversy mapping”. The project combined semantic tagging in weADAPT with innovative visualization techniques developed by Sciences Po to generate new insights about climate adaptation research and practice. The work was based on the dataset of adaptation projects maintained by weADAPT, along with project information from SEI’s Africa and Asia Centres, as outlined on the SEI website and in SEI’s internal Planning, Monitoring, Evaluation and Communication (PMEC) system.
*Download available from the right-hand column.
Results
High resolution images of the figures provided here and the main figures from the working paper are provided in Further Resources at the end of this article.
Global weADAPT dataset – issue-based analysis
The network graph in Figure 3 of the working paper maps organizations and the major issues (keywords or tags) they are working on, as determined by the frequency with which that the organization is linked to a keyword (from a project) in the dataset. The size of the node is determined by the degree centrality of nodes. This represents the number of links (“edges”) a node has i.e. the more keywords an organization node is linked to, the larger the node will be. This is also an indication of number of projects (and therefore the level of contribution to weADAPT by that organization) if one assumes that case studies on weADAPT contain a similar number of tags on average.
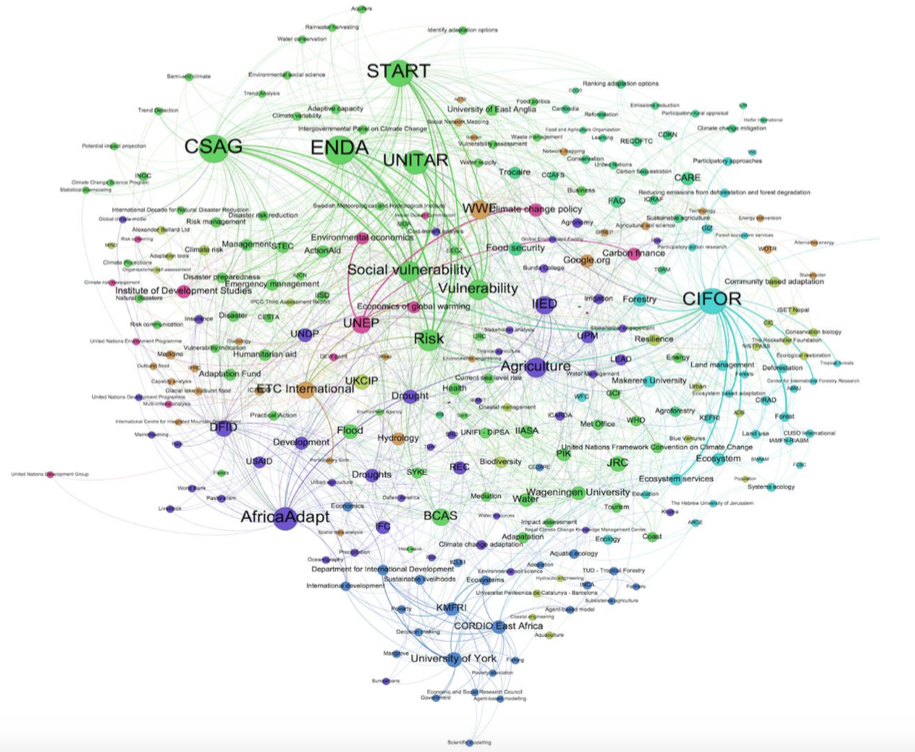
The organizations connected to the largest number of keywords (i.e. somewhat representative of number of projects from that organization) are easy to identify:– the Climate System Analysis Group (CSAG) at the University of Cape Town; ENDA Tiers-monde, START, the United Nations Institute for Training and Research (UNITAR), the Center for International Forestry Research (CIFOR) and AfricaAdapt. These are the largest nodes, and the fact that several are placed close together underlines their usage of common keywords (strength of connection) and thus commonalities (and sometimes collaborations) in their projects.
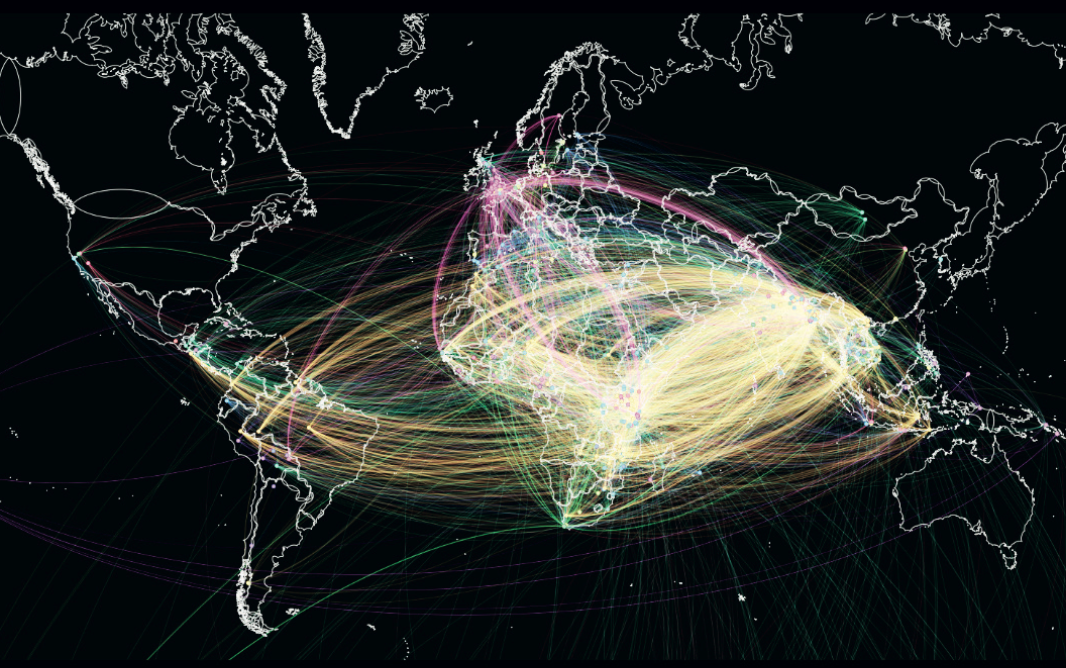
Global weADAPT dataset – geographic analysis
In this section, we show key issues that organizations are working on in different countries, as determined by the frequency of keywords that appear in the dataset in each country. The figure at the top-right of this article (Figure 9 in the paper) shows that there is a high proportion of community-based adaptation case studies globally, and a concentration of projects centred on adaptation decision-making in the UK. It also highlights regions with few or no case studies, such as North America, Australia and Russia.
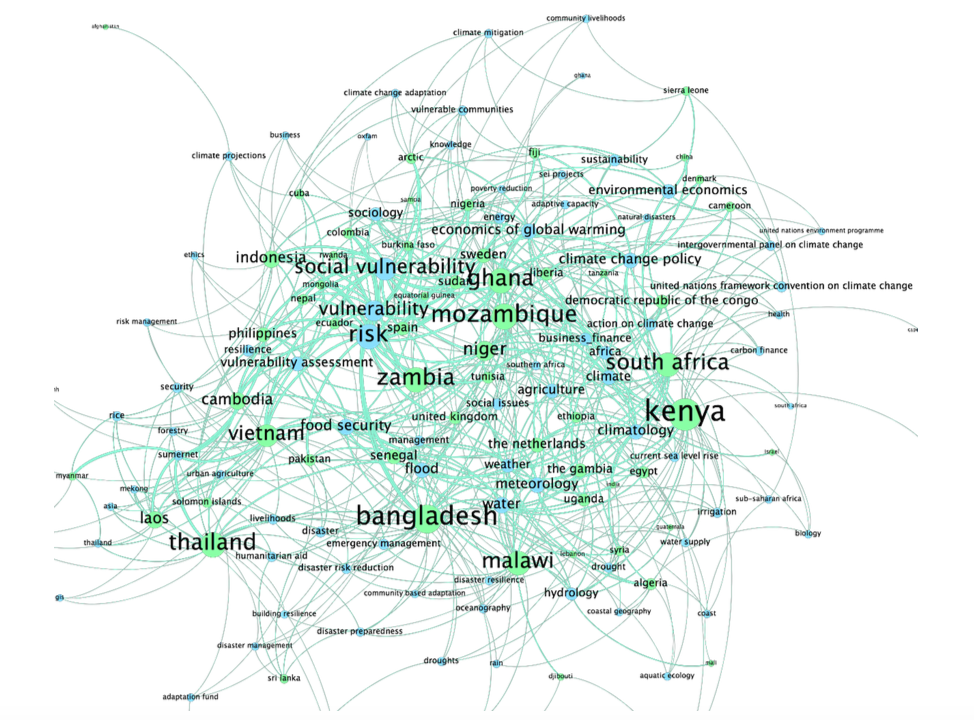
In Figure 11 of the paper, at a finer scale, it is possible to explore nodes that consist of i) country name derived from geo-coordinates of weADAPT case studies and ii) keywords associated with those case studies. This shows where most case studies were situated geographically and the primary issues being explored or different tools and methods applied in different countries as of April 2014.
Mapping SEI’s organizational networks
In order to explore the potential for highlighting gaps in SEI’s own network and potential new collaborations, we mapped data from SEI Africa and SEI Asia projects. The graphs show how this type of visualization can be used to identify strengths and weaknesses in organizational networks and uses data from 2014.
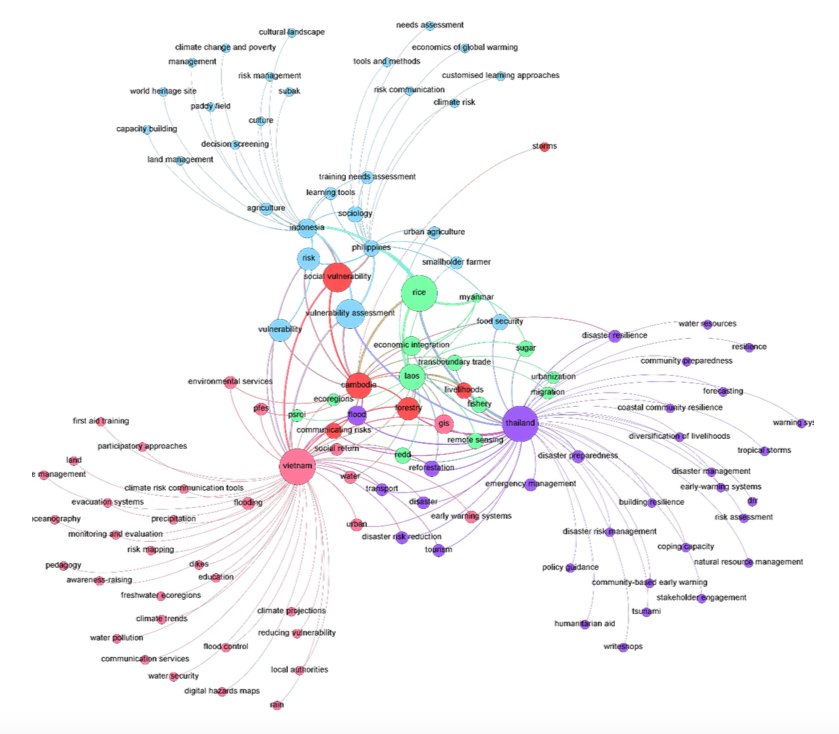
Figure 16 in the paper (below) shows that a large proportion of SEI’s work on climate adaptation focuses on disaster resilience and preparedness in Thailand and climate risk communication tools, climate trends and projections in Vietnam, while common areas of research in both countries are tourism, early warning systems, flooding and disaster risk reduction. There is also a large amount of work in the region on rice cultivation, social vulnerability, economic integration and transboundary trade. The Philippines and Indonesia are growing but very distinct areas of research (distant from the rest of the network), with new areas of work focusing on customized learning approaches for adaptation planning in small islands and governance analysis of cultural landscapes in a UNESCO World Heritage Site (in Bali, Indonesia).
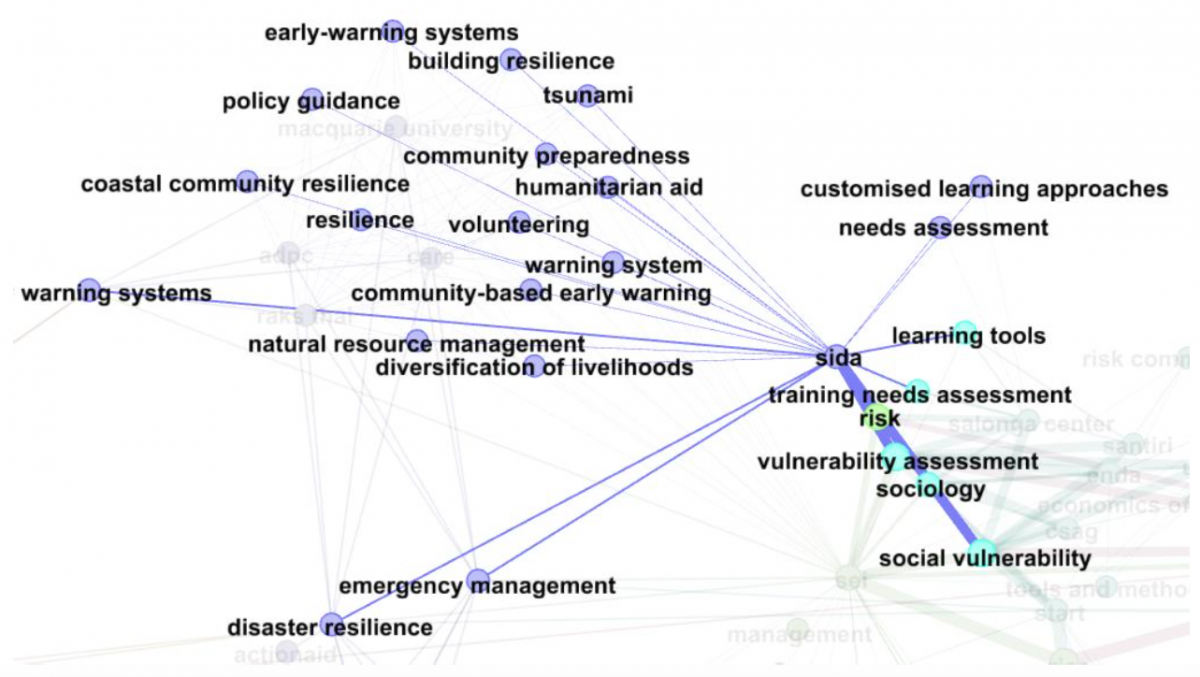
It is also possible to examine areas of work being funded by different donors. For example Figure 19 in the paper (below) shows that much of the work on disaster management, community preparedness, early warning, capacity-building and training by SEI in Southeast Asia has been supported by Sida.
Key Messages
Innovative visualization techniques have great potential in the field of climate adaptation and sustainable development, both to reveal patterns and relationships within complex datasets and to communicate complicated information in a simplified way to non-technical audiences.
We learned several lessons from the project which will greatly improve future analysis:
- Producing large networks is not a neutral process: from designing the research questions to be answered, to eliciting feedback, graphic design and presentation, there are assumptions and biases that need to be made explicit in any interpretation of the results.
- It is critical to start with clear research questions to know what data to collect and pre- process before visualization takes place.
- Regular feedback from boundary partners is essential to improve future iterations and the utility of the visualization technique.
- The time required to carry out visualization, data-cleaning and collate and incorporate partner feedback is often underestimated.
- There is a need to better understand the types of visualization that will be most useful to different boundary partners and stakeholders.
- Visualizations and resulting insights are limited in this study by the quality of the tagging or metadata applied. This is an area that can be improved, as we better understand our users’ content and information needs.
- While visualization can help us to ask better questions about our data, further research needs to be conducted on the ways in which visualizations are or are not effective in communication with boundary partners and stakeholders.
There are many potential variations of the networks graphs presented here. For instance, the graphs can have an interactive element and be hosted online, to introduce a dynamic aspect to visualize how a network changes over time when new data are added (see examples of this at www.climaps.eu, the output of the EMAPS project).
Overview of Methods, Tools and Limitations
Collecting the data:Strategy documents from SEI Africa and Asia were provided at an early stage in the project. Assessing these documents gave insights into which thematic areas of research were further focal areas for visualization and analysis.
Creation of a weADAPT API:In order to access weADAPT data in the format necessary for visualization a REST API was developed. This provided access to JSON data representing information needed for mapping a range of relationships in the weADAPT database.
Gephi:Using a combination of basic Python programming, tools and scripts for data manipulation, we constructed a methodology for producing the necessary network graph files. The primary means of visualizing this data was using Gephi open-source software developed in 2008 by the Médialab at Sciences Po. Gephi is designed to “leverage the perceptual abilities of humans to find features in network structure and data” (Bastian et al. 2009, p.361) and is capable of handling large data sets (20,000 nodes or more).
Limitations:The project used weADAPT data to test the applicability and utility of these visualization techniques to the field of climate adaptation. The results presented show how these techniques can be used to draw useful conclusions about the adaptation work represented on weADAPT. This is a limited dataset and thus of course not representative of the adaptation landscape as a whole.
Furthermore, qualitative analysis depends on the algorithm selected, choice of attribute/measures, initial seed, etc., but there was no investigation into the sensitivity of the outputs to such factors in this study. Therefore, all observations offered should be considered with these limitations in mind.
References
Bastian M., Heymann, S., and Jacomy, M. (2009). Gephi: an open source software for exploring and manipulating networks. Presented at the International AAAI Conference on Weblogs and Social Media. http://www.academia.edu/302513/Gephi_An_Open_Source_Software_for_Exploring_and_Manipulating_Networks.
Click on the links below to explore the high-resolution version of key figures
Recommended Citation:
Bharwani, S., Rastall, M., Smith, B., Salamanca, A., Nugroho, A., Nguyen, H., Yila, O. and Noel, S. (2015). Visualizing connections: Mapping the landscape of adaptation research and practice through weADAPT. SEI working paper no. 2015-08. Stockholm Environment Institute. http://www.sei-international.org/publications?pid=2812
Acknowledgements
The authors would like to thank Tommaso Venturini and Benjamin Ooghe-Tabanou of Sciences Po, and Richard Taylor of SEI Oxford, for their support throughout the CAMA project.
Related resources
- The EMAPS (Electronic Maps to Assist Public Science) Project
- High Resolution version of Figure 4: Other active organizations on weADAPT (excluding SEI and main partners)
- High Resolution version of Figure 6: ‘Hot topics’ in content shared by organizations on weADAPT in 2014
- High Resolution version of Figure 10: Geographic coverage of issues by country on weADAPT, 2013
- High Resolution version of Figure 16: Key research topics in SEI’s work in Southeast Asian countries
- High Resolution version of Figure 20: SEI’s adaptation research in Africa, by country and organizations involved
- High Resolution version of Figure 22: Key areas of research for SEI in East Africa
(0) Comments
There is no content