Introduction to climate modelling
Climate Modelling
Basically, climate modelling involves converting theories of atmospheric physics, solar radiation, phase state physics, etc. into mathematical formulas that can be solved by a computer. The relevant values are worked out for discrete areas (called grid cells) across the whole world, over a number of time steps. The result is a simulation of the climate – a simplified ‘copy’ of the climate system, worked out on a computer (so that lots of equations can be included and calculated relatively quickly). But it’s not that easy, in fact it’s not easy or simple at all. Not all theories are fully developed or understood. Lots of important processes that affect the climate in a given part of the world happen at scales smaller than the grid cell, like the interaction of air with mountains, the formation and dissipation of clouds, rainfall, etc. All these things are therefore captured in the models by ‘parameterisations’ (simplified representations), and this is where the major differences between climate models developed by different research institutions stem from. The influence of clouds is most likely the biggest source of uncertainty when it comes to projecting the climate and so this is a topic that is under extensive research currently. As climate models are being further developed, tested and refined and as computing power is increasing (i.e. able to make more calculations more quickly) so the spatial and temporal resolution of models is getting higher.
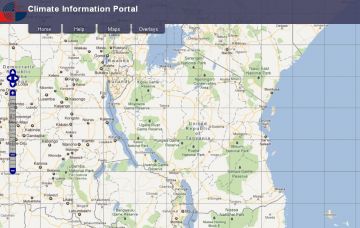
Map from the Climate Information Portal (CIP) showing the size of grid cells in the GCMs used in the IPCC Fourth Assessment over Tanzania (click on the image to go to CIP and navigate the map to your area)
Climate Projections
The basic procedure is to take a global climate model, run it using actual measured 20th Century concentrations of greenhouse gases (GHG), and compare the results with the observed 20th Century climate (i.e. the actual weather conditions measured regularly over the long term by instruments placed in various locations around the world), in order to establish what biases the model has built into it as a result of the way things are parameterized. Then run the climate model using projections of future GHG concentrations (linked to scenarios of how socio-economic development will take place); and compare the results for the projected future climate (of which there are many, each based on a different estimate of future concentrations of greenhouse gases) with those simulated for the 20th Century to calculate the differences or ‘anomalies’ (the amount of expected change). This amount of expected change can then be added onto the current observed / recorded climate.
But, as mentioned before, there are lots of climate models out there, developed by different research groups around the world, which one is best to use? If a model is good at simulating the 20th century, is it accurate for the future?
All models have strengths and weaknesses associated with them and represent some aspects of the climate better than others. For this reason it’s worth reviewing the outputs from a range of models when considering what the climate might be doing in your area of interest. This is why you’ll hear climate scientists advising people to look at the “envelope” of possible change, which means look at the range of results generated by different climate models for a given time period in the future using the same emissions scenario (i.e. the same estimate of GHG concentrations or that time in the future). Don’t forget that each model has certain biases built into it based on how it deals with / represents certain aspects of the climate system. If the models disagree about the kind of changes expected for a certain area (e.g. some suggest an increase in rainfall during the spring months in a certain area while others suggest a decrease), it’s important to consider why, to explore where that apparent uncertainty stems from, before we conclude what we can say with confidence about expected future rainfall in that area.
The reality is, however, that in most cases the model resolution (the area for which it gives one result) is not very useful for answering people’s pressing risk, vulnerability and adaptation questions on the ground because the data and information these global climate models provide is too general and large scale.
Downscaling
The climate in a specific place is a function of both the large scale climate state and local drivers, like features in the surface of the landscape (e.g. mountains), the land cover (e.g. forest versus cereal crop versus concrete), and the interactions with any large bodies of water nearby. Downscaling is an effort to determine the local response to a large scale climate state for a given location, either as a set of values characterising the climate for a much smaller area (or grid cell) than produced by the global models or for a single point on the globe.
There are two main types of downscaling, each with different strengths and weaknesses. Dynamical downscaling uses a limited area model to simulate the physical processes operating at the sub-regional scale, similar to the global climate models described above but just on a smaller scale for one specific region of the earth. Dynamical downscaling captures local feedbacks that are represented in the model, but it is difficult to validate how well the results match the observed reality. Statistical downscaling, sometimes called empirical downscaling, uses statistically derived relationships between the observed / measured local response and the observed / measured large scale climate state to calculate projected future local responses to the projected large scale climate states coming out of the global climate models. Statistical downscaling doesn’t have built in biases but the procedure doesn’t capture extreme conditions well. Downscaled climate data is usually what is used as an input to models that are developed to simulate / estimate / explore specific impacts of climate variability and change, for example on water runoff, crop yields, disease burden, etc.
When trying to develop a picture of what the climate is currently doing and might do in the future for a given place, it is important to combine many sources of relevant information. Firstly, make sure that you have some clear questions in mind relevant to the context of the place you are working, and that climate models are suitable tools for trying to answer those questions. If so, it is advisable to look at the outputs from a number of global climate models, as many as possible, bearing in mind that each one produces an answer, not the answer (i.e. none of them perfectly replicate reality rather each one is an attempt at producing a best estimate). Look at an analysis of observed historical data from your area of focus and then look at downscaled projections from numerous global climate models for various emissions scenarios, keeping in mind the strengths and weaknesses of the different methods used to do the downscaling and the significance of the different GHG concentrations that the climate scenarios are based on. Be careful and considered about what conclusions you can confidently draw in order to take a decision and justify it.
(0) Comments
There is no content