Using climate information to support adaptation planning and policy-making: A practical case study in Bagamoyo District, coastal Tanzania.
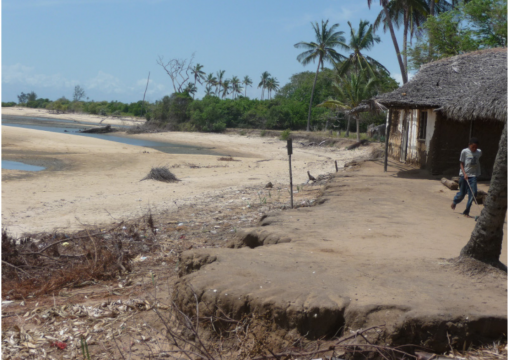
Coastal erosion in a village on the Bagamoyo Coast, Tanzania. Photo: Anna Taylor
Introduction
This case study provides a practical example of how to use climate information to support adaptation planning and policy-making, following the step-by-step guidance on weADAPT1. We focus on the Bagamoyo district in coastal Tanzania, north of Dar es Salaam (see Figure 1). The study builds on work done by the Pwani Project, an ecosystems-based coastal management initiative that, in turn, builds on work by the U.S. Agency for International Development (USAID), the Coastal Resources Center at the University of Rhode Island, and public- and private-sector partners in Tanzania2.
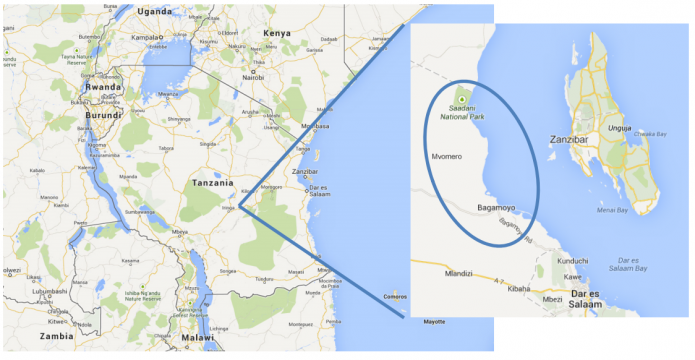
Figure 1: Map of Tanzania and the Bagamoyo coast to the north of Dar es Salaam.
The Pwani Project conducted a vulnerability assessment in two coastal rural villages of Bagamoyo district, Mlingotini and Kitonga, and this serves as the foundation for our analysis3. Local livelihoods are mostly based on natural resources, including small-scale agriculture (vegetables and fruits, plus rain-fed rice farming in Kitonga), seaweed farming, traditional fishing and small-scale eco-tourism. People live close to the sea and are very aware of the tides, seasonality of rain and direction of the wind. They also report that climate variability and climate change are affecting their lives.
Specifically, villagers describe the following climate change and variability impacts:
- The timing and intensity of rainfall are no longer reliable: rains early in the season are heavier than they used to be, but later in the rainy season, conditions may be dry.
- Sea-level rise has resulted in saltwater intrusion, contaminating groundwater that households draw from wells, and leading to the formation of saline soils.
- The shoreline is eroding; this is attributed to sea-level rise and severe floods on the coast itself and along rivers.
- There have been changes in the water temperature and salinity of the ocean.
- Droughts have occurred several times in recent years: in 1997, 1998, 2000-2004, 2008 and 2009.
- The direction and strength of seasonal prevailing sea winds are no longer predictable. This affects fishing and safety at sea, but also agriculture, because prevailing winds have traditionally been used as indicators of the crop-planting season.
- Major floods have occurred, in 1996 and 2006
These impacts have all tangibly affected villagers’ quality of life and increased their vulnerability to food and water scarcity, infrastructure damage, ill health and earnings losses. Both flood and drought events are perceived by villagers as having a dramatic impact on crop productivity, and in some cases cause a total crop loss. In addition, floods often damage to local infrastructure, particularly along the main inundation and water flow routes, as well as homes and vegetation, and they harm livestock. Without predictable precipitation patterns, planning for rain-fed crops is difficult and food security is threatened. Thus, there is an urgent need for effective adaptation and coastal ecosystems management, especially as experts predict that the impacts of climate change will increase over time.
Using climate information to support adaptation in Bagamoyo
In this section, we describe how we used weADAPT, an adaptation knowledge platform developed by the Stockholm Environment Institute, and the Climate Information Portal (CIP), developed by the Climate System Analysis Group at the University of Cape Town, to identify key climate risks and their potential impact, as well as priority adaptation needs in Bagamoyo district. A village vulnerability assessment already conducted under the Pwani project is used as input to this work. As noted in the introduction, we follow an eight-step process, per the guidance provided on weADAPT (see footnote 1).
Step 1: Clearly define the question
Villagers’ observations indicate that conditions are changing in multiple ways. The challenge for policy-makers is to understand how future climate change might further affect the region, and to try to set priorities for adaptation. Through CIP, we can examine detailed data on daily temperatures and rainfall, observed and projected. In addition, we can look at sea-level trends data (both historical and future trends), drawing on a comprehensive analysis for Tanzania that we found in the literature.
Thus, we define the question as: What do current trends in temperatures, rainfall and mean sea level, and medium and long-term projections, suggest are the most serious climate risks that government officials in Bagamoyo district need to address?
We will start by evaluating the climate hazards that local villagers currently face, and the impacts of those hazards on their lives. We then want to look at the future climate projections to examine how these risks might change over time, so that decision-makers can factor these climate considerations into their coastal management strategies and plans.
We will look at rainfall patterns in terms of distribution and intensity, as both have major implications for agriculture and other livelihoods in the area. Looking at the temperature data, we will look at overall patterns and especially at the number of hot days (with highs exceeding 36°C) and mean dry spell durations; the data are relevant to the evaporation rate and to crop production cycles, and also indicate the level of risk of heat stress, which affects both crops, and people’s health and ability to work. High temperatures may also cause changes in local fisheries dynamics and affect seaweed farming.
Step 2: View climate stations on the weADAPT-CIP interface
First, we go to the map in weADAPT called the Adaptation Layer4 and click on the “view climate stations” button at the top of the page. We see the closest station to our study area is at Dar es Salaam International Airport, about one hour’s drive to the south of Bagamoyo district.
There are also other stations nearby, such as Zanzibar and Morogoro, which might provide useful data for our climate analysis. The Morogoro station seems a bit far (a three to four hour drive away) and is also inland, which means it is likely to have a different climate than our coastal site. However, it may be important to consider this station when looking at rainfall patterns and potential flooding events, as the Wami river, which flows into the Indian Ocean near Bagamoyo district, originates in the mountains of the Morogoro region. The data for Zanzibar, meanwhile, are largely influenced by island conditions and the ocean, and might skew our analysis. However, for a more in-depth study, it might be interesting to compare the data for Zanzibar and mainland stations in the coastal zone.
Thus, we will focus primarily on climate data from Dar es Salaam International Airport station, as there are no major climatic influences from mountains, water bodies or forests between Dar es Salaam and the Bagamoyo area.
Step 3: View historical climate data on weADAPT-CIP
Figure 2 shows historical monthly climate averages for the Dar es Salaam station. As recommended in the CIP guidance, we explore issues such as:5
- Seasonality: When are the wet and dry seasons?
- Bi-modal seasons: Is there more than one wet season?
- Inter-annual variability: Are there months with particularly high variability?
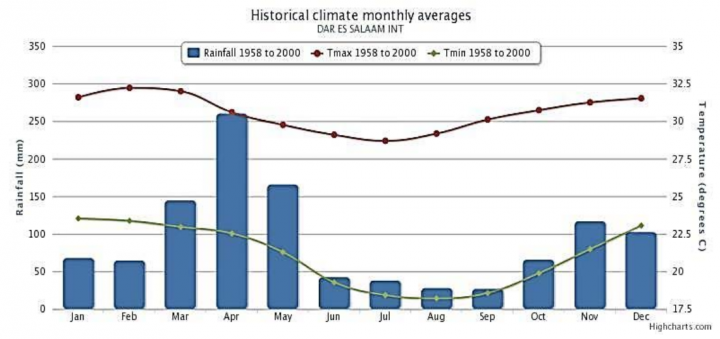
Figure 2: Climate monthly averages, Dar es Salaam International Airport, 1958-2000
The timing of the onset and cessation of the rainy season is very important for crop management, and thus for food security. Furthermore, months with high rainfall variability are important to note, as this variability may have consequences for agriculture and other sectors.
Figure 2 clearly shows, for the 1958-2000 period, a bimodal rainfall pattern characterized by two rainfall seasons, typical for the tropics: a long rainy season (March to May) and a short rainy season (October to December). The wettest month has historically been April, with a monthly average of more than 250 mm between 1958 and 2000. On the other hand, the driest month has historically been September, with an average of 27 mm of total monthly rainfall. The driest periods are June throughout September, and then January and February. Historically, the minimum average temperature recorded is 18.2ºC in August, while the maximum average temperature is in February, 32.2ºC.
Next, we look at the observed monthly rainfall totals from the same period showing the 10th to 90th percentile inter-annual range (i.e. eliminating the extreme figures on either end), as shown in Figure 3. We find high inter-annual variability, especially in November (a range of 10 to 260 mm) and onwards through to May. This indicates that the highest inter-annual variability occurs during the rainy seasons; there is some degree of inter-annual variability in the months between the short and the long rainy season as well. This big range makes statistical analysis important in discerning, which is important to bear in mind when collecting and analyzing data on local perceptions of change.
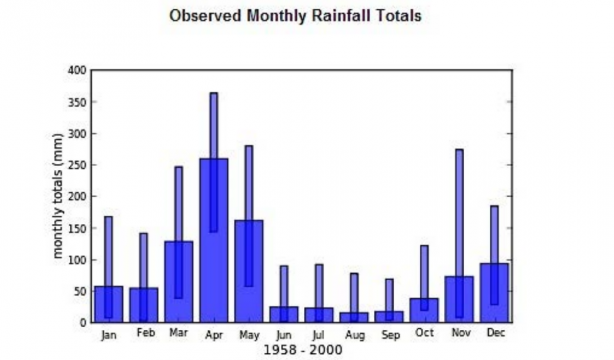
Figure 3: Observed monthly rainfall totals, 1958-2000 (10th to 90th percentile)6
Now we click through to CIP to look at the full time series of rainfall, shown in Figure 4.7.
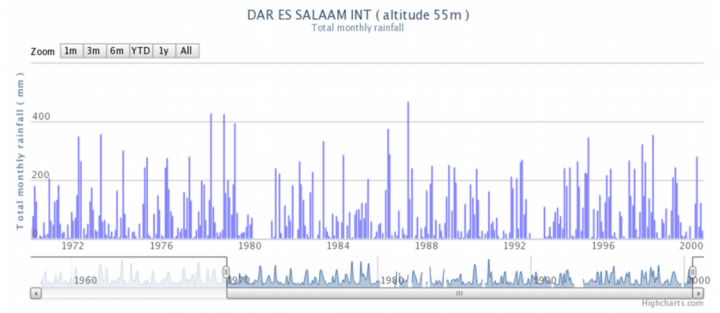
Figure 4: Total monthly rainfall, Dar es Salaam International Airport, 1970-2000
The data for 1970-2000, as shown in Figure 4, indicate that historically, total monthly rainfall peaks have predominantly occurred during the long rainy season (March, April and May), but there has been remarkable rainfall variability over the years. The records show months with particularly high rainfall, with totals of more than 400 mm (e.g. March 1987, with 469 mm). There are also several instances of wet-season years with less than 300 mm of rain, such as December 1970 (209 mm), May 1992 (273 mm), and November 1994 (266 mm).
We take a closer look at the rainfall distribution patterns for the period 1994-2000 to assess whether they match villagers’ perceptions, as identified in the Pwani Project vulnerability assessment. We need to consider not only the months with large volumes of total rainfall (Figure 4), but also how many days it rained in these months, and how many days per month received heavy rain (>20mm). Figures 5 and 6 show the relevant data.
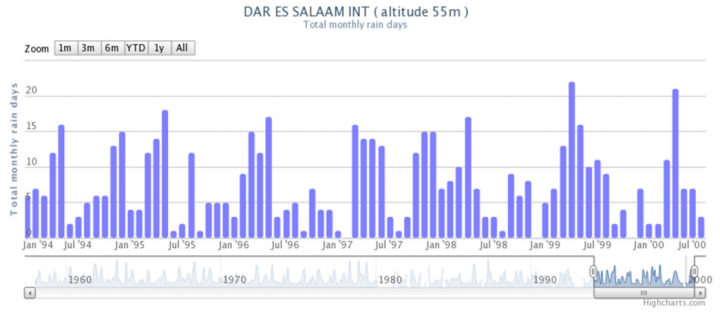
Figure 5: Total monthly rain days, Dar es Salaam International Airport, 1994-2000
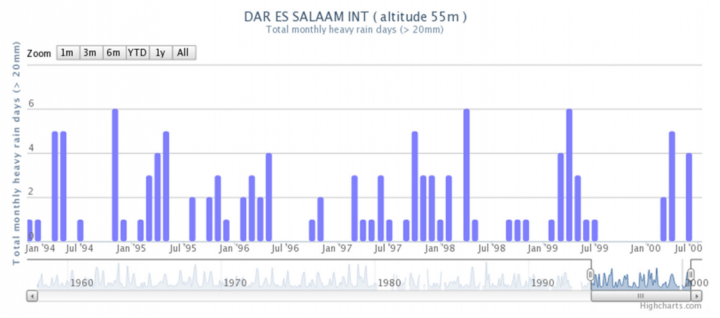
Figure 6: Heavy rain days (>20 mm), Dar es Salaam International Airport, 1994-2000
Villagers spoke of droughts in 1997, 1998, 2000-2004, 2008 and 2009 (see introduction and footnote 3). In 1996 and again in 2006, floods destroyed all food crops, resulting in widespread hunger. We only have historical data until 2000, but we can compare local perceptions with the data up to that period. We cross-reference the reported flood and drought dates with data for total monthly rainfall, total rain days and heavy rain days (>20 mm), as shown in Table 1. Note that none of these data points show the exact amount of rainfall received on a given day, except whether in terms of the 20 mm threshold.
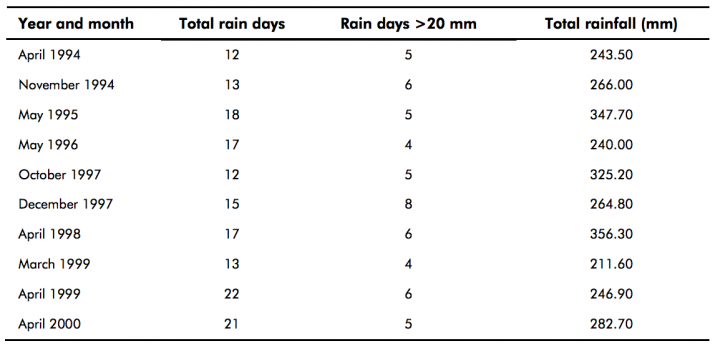
Table 1: Particularly rainy months, Dar es Salaam International Airport, 1994-2000
We see several months with unusually large amounts of rain, most notably May 1995 (347.7mm), October 1997 325.2 mm) and April 1998 (356.3 mm), all three of which also had five or more days of heavy rain (>20 mm per day). Several other months also show large numbers of rain days. Notably, however, 1996 does not stand out in the data: the wettest month in 1996 was May, with 240 mm of rain and four days of heavy rain.
Rainfall is only one of several factors that can trigger floods, however – land use, vegetation type, soil moisture, etc., can also play a role. In addition, there may be differences in what people characterize as a flood: is it about river levels and/or flows, standing water in fields, volume of rain, length of uninterrupted rain, damage to houses? Meteorological data can only verify some of those phenomena. Moreover, floods can be triggered by heavy rainfall further inland that swells rivers flowing towards the Indian Ocean – which is why we wanted to keep the Morogoro station in mind (discussed further below).
Next we check the data for years of reported droughts. We need to look for years with a lateonset and/or shorter rainy season yielding lower than average rainfall totals for the 1994-2000 period (where data are available). Drought is likely to be perceived if it does not rain when it is meant to rain, thus damaging crops. Missing the onset of a rainy season for planting crops could also be associated with drought episodes by the villagers, as these could have serious consequences for the local farmers.
The data indicate that the short rainy season in late 1996 ended a month early, with only 12.1 mm of rain in December; this might account for reported drought in 1997, though later in the year there was plenty of rain. In 1998, the short rainy season came early, in September, but also ended early, with no rain in December 1998. In the long rainy season in 1998 and again in 2000, the recorded monthly rainfall totals were significantly below average, 67 mm in May 1998 and 43 mm in May 2000, which could have affected crop yields, though in 2000, rainfall varied significantly (e.g. 122.20 mm in March, 282.7 mm in April and 43.3 mm in May). Still, with such limited data, it is difficult to say reliably whether the climate record confirms villagers’ perceptions. Further insights could be gained by assessing the timing of dry spells within the rainy season, along with start and end dates for the rains, and the water requirements of the crops grown in the Bagamoyo area at different stages of their life cycle8. With the data available in this analysis it is difficult to draw firm conclusions as the processes leading to droughts and floods are complex. There are, however, indications that community perceptions are matched by periods of anomalous rainfall in the data.
Looking at the broader area: Morogoro
For a fuller picture, we try to compare data from the Dar es Salaam station with that of the Morogoro station. However, we quickly discover gaps in both the temperature and rainfall data for Morogoro, including during key periods of interest to us, such as the rainy seasons in 1996, 1997 and 1998. There are too many months missing to get a clear sense of patterns or unusual spikes or dips.
We look beyond CIP, to a 2007 study that includes data of the monthly mean flow of the Ruvu river in Morogoro9. Peak flows in the Ruvu river and its tributaries are generally observed in April. Most of the flow volumes (69%) are observed during the two rainy seasons, indicating a possible increase in surface runoff due to catchment degradation caused by land use change. Such conditions are reflected in high surface runoff and a short lag time between the rise and drop in water levels. The data show that in 1985-2004, a higher proportion of peak runoff occurred during the peak flow months than had been the case in the 1950s and 1960s. The study also notes that local people report that heavy rain often causes floods, but the floods recede quickly once the rain stops. But there is not enough data to confirm whether the reported 1996 floods in Bagamoyo correspond with unusually high flows in the Ruvu river.
Sea level trends
As noted in the introduction, villagers also report that sea levels are rising, and saltwater is getting into their freshwater wells and also salinating the soil. To compare those observations with relevant data, we turned to a study of sea-level rise along Tanzania’s coast published in 200910. Model reconstructions of sea level trends for 1955-2003, the study finds, show an overall rising trend in Tanzania (0.4 to 2.0 mm/year) and the Western Indian Ocean (-0.4 to 2.4 mm/year), while the global average is estimated at -0.4 to 3.6 mm/year for that period.
However, sea level data for more recent years show great variation, with about 60% of tide gauge stations in the Western Indian Ocean region showing rising trends of relative sea levels, and the other 40% showing falling trends (only stations with at least four years’ data were included). Near our area of interest, both Dar es Salaam (1986-1990) and Zanzibar (1984-2004) show falling trends. Yet the study also notes that the absence of adequate operational tide gauge stations is a limiting factor in determining the regional sea level trends – and except for the Zanzibar station, which has a continuous record, the data records for Tanga, Dar es Salaam and Mtwara are all very short, and several years have incomplete data records. Still, the study notes, the data are consistent with a 2007 contour map from satellite altimetry that showed sea levels declining by 0-3 mm per year in the northern part of Tanzania’s coastline, and by 3-6 mm per year in the south, during 1993-2003. However, a contour map of the regional model reconstruction of sea level using a combination of in-situ tide gauge data and satellite altimetry for 1955-2003 showed rising sea level trends in the north (1.2 mm/year) and in the south (2.0 mm/year).
So it is hard to get a clear overall picture of sea level trends. Our reading of the data suggests that sea-level rise is unlikely to have already made a major impact on the Bagamoyo area 11. Moreover, there are other potential reasons for the problems reported by villagers. For example, there is extensive literature showing that groundwater pumping, by lowering the water table, can lead to saltwater intrusion in coastal aquifers 12. And shoreline erosion – which is quite visible – could be primarily due to storm surges, or to coastal development or other changes to the landscape that have left beaches more exposed to the tides.
Step 4: View future climate projections
We now look at the statistically downscaled13 CMIP514 projections for Dar es Salaam, using the RCP8.5 scenario (high emissions). We look first at near- to medium-term projections (2020-2040), as our goal is to inform coastal management and development planning, which works on cycles of five to ten years. But we also want to keep in mind how the climate risks may evolve in the longer term, to ensure that near-term choices are sustainable in the longer term, so we also look at the 2040-2060 period.
Figure 7 shows how the number of heavy rain days (>20 mm) might change by 2020-2040, compared with the 1958-2000 record. The lines show the results for each of 10 climate models; the coloured bars indicate patterns in the data.
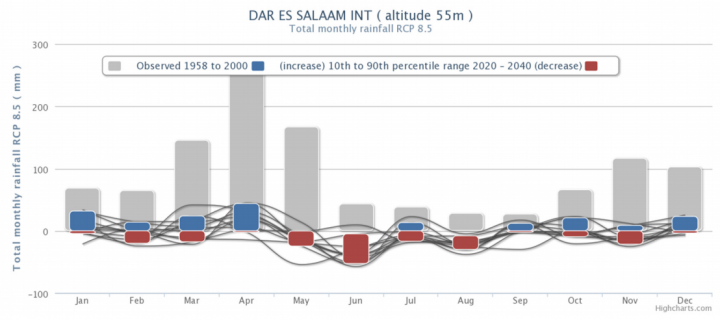
Figure 7: Projected changes in total monthly rainfall, Dar es Salaam International Airport, 2020-2040, under RCP 8.5
A look at the 2020-2040 and 2040-2060 projections together suggests several changes ahead:
- A very likely decrease in the length of the long rainy season, as all 10 models agree (e.g. see projected decrease in monthly rainfall in May) in the near to medium (2020-2040) and the long term (2040-2060).
- The short rainy season might be affected, with a potential decrease in November and an increase in January. However there is not full agreement among climate models on this (see Figure 7 and future climate projections for 2040-2060 on CIP).
- Most models suggest an increase in total monthly rainfall during April, especially in the near to medium term. Only a few show a possible decrease during April in the longer term (2040-2060). Hence, April is likely to stay the wettest month, and with a higher monthly average might result in more extensive flooding events.
- In the longer term (2040-2060), all models suggest there could be a longer drier season (see from May to August and even potentially into September and October).
- In the shorter term (2020-2040) this trend is not that obvious, as a few models show a potential increase in the total monthly rainfall during July.
Changes in monthly rainfall totals and in the onset and end of the rainy seasons are particularly significant for farming activities, as certain crops (e.g. maize) require a particular volume of rainfall in a given time to grow. The changes would also affect farmers’ ability to plan and choose appropriate planting times in the future – which, as noted earlier, they already say is a challenge. Next, we look at the number of wet days (> 20 mm), shown in Figure 8.
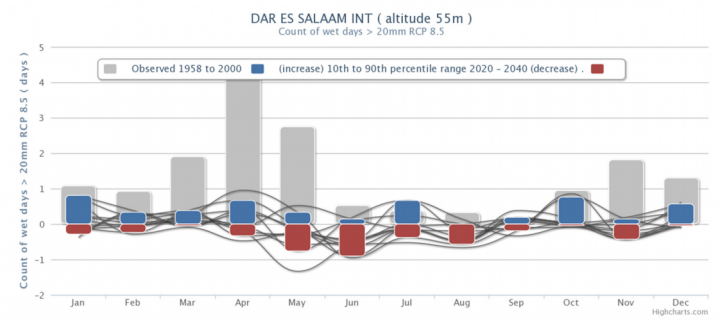
Figure 8: Projected changes in number of heavy rain days, Dar es Salaam International Airport, 2020-2040, under RCP 8.5
This parameter is important because very heavy rains can cause floods and damage crops; they can also affect fish in the area and contribute to the erosion of the shoreline due to storm surges. Looking at this and at 2040-2060 projections, we make several observations:
- The number of wet days (>20 mm of rain) from January to April may increase, although a few models suggest a decrease. Almost all models show an increase in wet days in October and December during 2020-2040.
- For the long term (2040-2060), there is no clear pattern, however. All the models show a decrease in the count of wet days in May, June and July in the longer term (see the 2040-2060 trends on CIP). However, the changes seem small (i.e. all less than +/- 1 day).
Next we look at projections for the duration of dry spells – days or weeks with no precipitation. Figure 9 shows near- and medium-term projections.
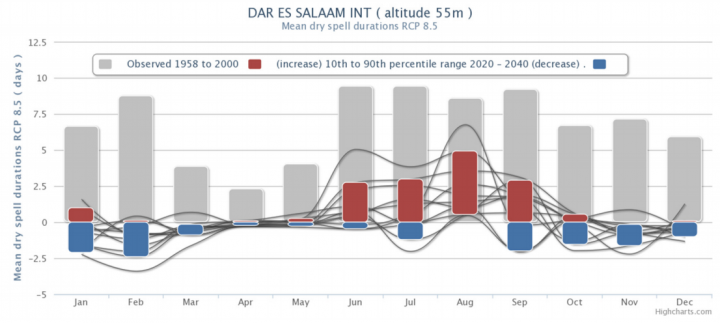
Figure 9: Projected changes in mean dry spell durations, Dar es Salaam International Airport, 2020-2040, under RCP 8.5
Even in the near to medium term, we see some patterns: modest decreases in the length of dry spells in the late and early parts of the year, and projected increases in the mean dry spell duration from June to August (shown in 9 of 11 models). However, in the longer term (2040-2060) is harder to determine what might happen, as there is less agreement among the models, especially in the late part of the year.
Let’s now have a look at the average maximum temperature, as it is important in terms of crop and human heat stress and labour availability in the village as well as general implications for any livelihood activity in the coastal area:
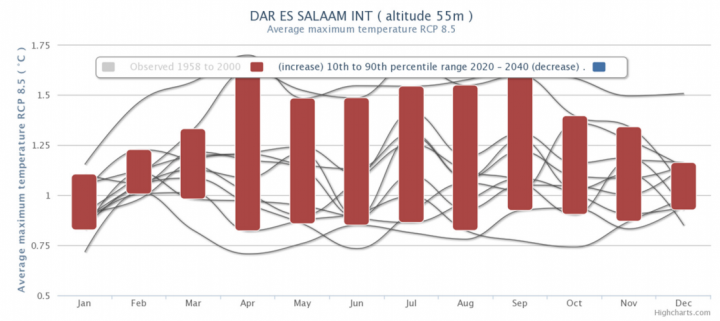
Figure 10: Projected changes in average maximum temperature, Dar es Salaam International Airport, 2020-2040, under RCP 8.5
All models suggest a likely increase in the average maximum temperature, with the greatest projected changes from April through September; note that historically, April and May have been relatively warm, but June through September are relatively cooler. Most models suggest an average maximum temperature increase of about 1.5-2°C over the long term (by 2040-2060). In the short to medium term (2020-2040), the average maximum temperature is expected to increase by 0.85-1.65°C. The warmer it gets, the greater the potential impact on crop yields15.
Next we look at the number of hot days (with highs above 36°C), as extreme heat has an even greater impact on crop productivity, evaporation rates and human and livestock health.
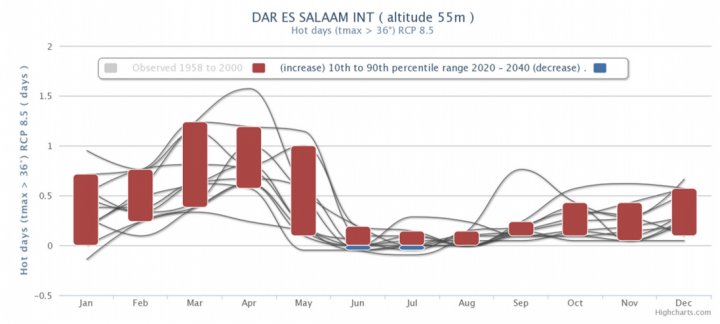
Figure 11: Projected change in number of days above 36°C, Dar es Salaam International Airport, 2020-2040, under RCP 8.5
In the near to medium term, the models suggest a small increase in the number of very hot days, with the largest increases in January, March and May. In the longer term (2040-2060), the model projections vary considerably, with a range of 1 to 4 extra hot days projected for some months. Tanzania’s National Adaptation Programme of Action (NAPA) recognises rising temperatures and extreme heat as climate risks that need to be addressed16.
Future sea level trends
It is quite a difficult task to find accurate, site-specific data on future sea level trends. Hence, the data found is more on general future projections for global sea level change. There is broad agreement, as noted by the Intergovernmental Panel on Climate Change, that sea levels are likely to rise faster in the 21st century than they had in recent decades. The IPCC Fourth Assessment Report found global sea-level rise projections ranging from 18 to 59 cm by 2099, relative to 1980-1999, and based on research since then, the Fifth Assessment Report, to be published later this year and in early 2014, is expected to revise those projections upward 17.
For adaptation planning purposes in Tanzania, the scenarios typically discussed are 50 cm to 1 metre of sea-level rise by 2100 – either of which would be devastating to coastal areas, including Bagamoyo19.
Step 5: Look at data for other nearby stations
If we look through the data from the Morogoro station, the future climate projections suggest similar patterns to our earlier interpretations for the Dar es Salaam station. For example, in terms of rainfall, there might be an earlier end to the long rainy season, with all models agreeing on a notable decrease in monthly rainfall in May under RCP 8.5. The majority of models also here suggest a potential increase in the total rainfall in April. Likewise, average maximum temperatures are quite likely to increase, as is the count of very hot days (>36°C) in October to April.
Step 6: Ask, ‘so what?’
This case study shows the value of examining climate data to supplement, confirm and clarify direct observations. However, it also illustrates the challenges in using climate data, especially when there are gaps in the historical record, and models of future climate change show no clear patterns in the medium and longer term. Looking at the future of Bagamoyo district, there is a great deal of uncertainty about climate hazards. No single, clear message emerges from our analysis, and the climate data graphs require careful reading and interpretation.
We learned that it is important to be cautious in predicting the future, and to compare different sources of data. This is a particularly sensitive issue in dealing with stakeholders’ perceptions of climate risks. While it is important to document and acknowledge those perceptions, they need to be checked against the available data to ensure a more comprehensive view of the issues. People are also likelier to remember accurately what has happened over the past few years than over longer periods. At the same time, we need to remember that any one weather station provides a very limited view of climatic conditions.
The comparison of historical data with local perceptions reinforces the need to use multiple sources of evidence when assessing climatic changes. It also shows that as questions become more specific, more detailed and time-consuming analysis is needed. Another key insight is that climate data only tell us so much. Models can give us a sense of how patterns may change, for example – but to know whether heavy rains will cause floods, or significant damage, we need to look at the hydrology of the region, and how land use changes, for example, might have increased flood risks. (Similarly, as we noted earlier, saltwater intrusion is a common problem when groundwater is pumped in coastal areas – with or without sea-level rise.)
The clearest trends we see are in maximum temperatures and the number of very hot days (>36°C), both of which seem likely to increase in the Bagamoyo area. This raises serious concerns for farming activities (with higher evapo transpiration rates and affecting the overall crop production cycles), including seaweed farming, which tends to be sensitive to temperature increases as well.
In addition, an increase in the number of hot days has serious implications for health, potentially affecting the labour availability in the area. Shifts in the rainfall patterns place additional stress on agriculture. This reinforces the need to find alternative agricultural practices (e.g. conservation agriculture19 cassava, which is also an important source of household food security in the Bagamoyo area.
Whether or not climate change is the main cause of Bagamoyo’s saltwater intrusion and soil salinization problems, clearly those issues need to be addressed. Tanzania’s NAPA includes several measures to protect coastal water resources and reduce local people’s vulnerability to water scarcity20. It may also be helpful to look for salt-tolerant crop varieties and trees that can withstand more saline conditions. Likewise, coastal erosion is a well-known problem in Tanzania, and several strategies can be implemented to address it – from curbing illegal sand mining, to increasing coastal forest buffer zones 21.
The combined effects of multiple climate and non-climate hazards make it challenging to prioritize adaptation options. However, our analysis suggests that efforts from the district government to improve zoning and land-use rules and to build appropriate water drainage structures and channels as well as sanitation infrastructure might help reduce the vulnerability of the area. They would also complement existing community-based adaptation efforts already taking place in Bagamoyo district (see footnote 3). A further detailed technical study on the assessment and ranking of adaptation options would complement this work and would be important in making decisions regarding the coastal zone.
Step 7: Find other places facing similar issues
Searching on weADAPT, we found several relevant articles and examples of adaptation strategies in coastal areas that could be useful in taking this work forward. They include:
- An article on social protection and health that explains how multiple climate stressors such as heat stress, flooding and droughts can affect health: http://weadapt.org/knowledge-base/vulnerability/social-protection-health.
- An article on introducing salt-tolerant species and preparing for disasters in India: http://weadapt.org/placemarks/maps/view/899.
- A description of the Gazi mangrove restoration project in Kenya provides useful ideas of restoration activities on the coastline to help reduce shoreline erosion: http://weadapt.org/placemarks/maps/view/752.
Step 8: Add your story to weADAPT
We hope that you will find this case study useful in your own work. We encourage you to share your findings and insights as well on weADAPT, so we can all continue to share ideas and learn from one another.
Acknowledgements
I would like to thank the team from the Climate System Analysis Group (CSAG), at the University of Cape Town, especially Ross Blamey and Joseph Daron, for their support and feedback to this case study. I am also very grateful to Abubakar Kalema, Lusanda Nxodo and Dominique Doyle for their contributions to this case study during the CSAG Winter School at UCT. I also would like to acknowledge my SEI colleagues Anna Taylor and Ben Smith for their insightful comments, advice and excellent suggestions for this document, as well as SEI editor Marion Davis.
The inspiration for choosing this location comes from a piece of work previously contributed to weADAPT by Donald Robadue Jr (Article | Case study).
This document has been produced with funding from the Climate Change Capacity Development (C3D+) project, which is supported with core funding from the European Commission (EuropeAid/DCI-ENV/2008/149684/TPS) with supplementary funding from the Austrian Development Cooperation and the Swiss Government.
References
1. See Taylor, A. (2013). Using climate information to support adaptation planning and policy-making: A step-by-step guide. weADAPT. http://weadapt.org/knowledge-base/using-climate-information/guide-to-using-climate-information.
2. For more information about the project, see Robadue, D. (2012). The Conservation of Coastal Eco-Systems in Tanzania: The Pwani Project. weADAPT. http://weadapt.org/knowledge-base/vulnerability/climate-changeadaptation-in-tanzanias-coastal-villages.
3. Tobey, J., Meena, H., Lugenja, M., Mahenge, J., Mkama, W. and Robadue, D. (2011). Village Vulnerability Assessment and Adaptation Planning: Mlingotini and Kitonga, Bagamoyo District, Tanzania. Pwani Project, funded by the U.S. Agency for International Development. Coastal Resources Center, University of Rhode Island, Narragansett, RI, US. http://www.africa-adapt.net/themes/195/resources/745/project/.
4. See http://weadapt.org/placemarks/maps.
5. See http://cip.csag.uct.ac.za/webclient/introduction.
6. This graph was made with an older version of CIP, accessible here: http://cip.csag.uct.ac.za/webclient/introduction.
7. See http://cip.csag.uct.ac.za/webclient2/app/.
8. See, for example, analyses for Mozambique: http://weadapt.org/placemarks/maps/view/450, and Southern Africa http://filestore.wikiadapt.org/wikiADAPT/Growing_Season_Changes_Southern_Africa.pdf.
9. Zanda, P. Z. and Munishi, P. K. T. (2007). Hydrologic and Land Use/Cover Change Analysis for the Ruvu River (Uluguru) and Sigi River (East Usambara) Watersheds. Report commissioned by WWF/CARE. Dar es Salaam,Tanzania. http://easternarc.or.tz/downloads/East-Usambara/Final%20Report_Revised_10_03_2007.pdf.
10. Mahongo, S. B. (2009). The Changing Global Climate and its Implication on Sea Level Trends in Tanzania and the Western Indian Ocean Region. Western Indian Ocean Journal of Marine Science, 8(2), 147–159. DOI:10.4314/wiojms.v8i2.56971.
11. Tanzania’s National Adaptation Programme of Action (NAPA), however, explicitly links Bagamoyo’s current problems to sea-level rise: “Unfortunately, the effect of sea level rise is already being experienced in Coast region, in Bagamoyo District. In this region sea level rise has resulted into inundation of some traditional water sources.” See United Republic of Tanzania (2007). National Adaptation Programme of Action. http://unfccc.int/resource/docs/napa/tza01.pdf, p.42.
12. See, for example, Ferguson, G. and Gleeson, T. (2012). Vulnerability of coastal aquifers to groundwater use and climate change. Nature Climate Change, 2(5). 342–45. DOI:10.1038/nclimate1413.
13. Downscaling is a method that derives local- to regional-scale (10 to 100 km) information from larger-scale models or data analyses. The empirical/statistical methods develop statistical relationships that link the large-scale atmospheric variables with local/regional climate variables. In all cases, the quality of the downscaled product depends on the quality of the driving model (IPCC AR4 Glossary).
14. CMIP5 = Coupled Model Intercomparison Project Phase 5, a new set of climate model experiments coordinated between 20 climate modelling groups from around the world.
15. For example, one study found that in a scenario in which mean temperatures increased by 1.87°C across Tanzania by 2041-2050, dry-land maize yields in the Pwani region would decline by 6.25%; a more modest 1.13°C increase would reduce yields by 1.83%. See Arndt, C., Farmer, W., Strzepek, K. and Thurlow, J. (2012). Climate Change, Agriculture and Food Security in Tanzania. Policy Research Working Paper 6188. The World Bank, Development Research Group, Agriculture and Rural Development Team, Washington, DC. http://hdl.handle.net/10986/12045.
16. See United Republic of Tanzania (2007), op.cit. (footnote 11).
17. See http://www.ipcc.ch/publications_and_data/ar4/wg1/en/ch10s10-es-8-sea-level.html. For an explanation of why the AR4 projections are considered too low, see Rahmstorf, S. (2010). A new view on sea level rise. Nature Reports Climate Change, 1004. 44–45. DOI:10.1038/climate.2010.29.
18. See, for example, Kebede, A. S., Brown, S. and Nicholls, R. J. (2010). Synthesis Report: The Implications of Climate Change and Sea-Level Rise in Tanzania – The Coastal Zones. Tyndall Centre for Climate Change Research. http://economics-of-cc-in-tanzania.org/images/Tanzania_coastal_report_draft_vs_2_1_.pdf
19. For a quick primer from the UN Food and Agriculture Organization, see http://www.fao.org/ag/ca/.
20. See United Republic of Tanzania (2007), op.cit. (footnote 11). Section 3: Project Title: Shifting of Shallow Water Wells Affected by Inundation on the Coastal Regions of Tanzania Mainland and Zanzibar.
21. See, for example, Mustelin, J., Khamis, M., Klein, R. G., Mzee, A. J., Haji, T. A., Asseid, B. and Sitari, T (2011). Coastal Forest Buffer Zones and Shoreline Change in Zanzibar, Tanzania: Practical Measures for Climate Adaptation? In Experiences of Climate Change Adaptation in Africa. W. L. Filho (ed.). Climate Change Management. Springer Berlin Heidelberg. 133–51. http://link.springer.com/chapter/10.1007/978-3-642-22315-0_8. Also: Mustelin, J., Klein, R. G., Assaid, B., Sitari, T., Khamis, M., Mzee, A. and Haji, T. (2010). Understanding current and future vulnerability in coastal settings: community perceptions and preferences for adaptation in Zanzibar, Tanzania. Population and Environment, 31(5). 371–98. DOI:10.1007/s11111-010-0107-z. And: Kebede et al. (2010), op.cit. (footnote 18).
This document has been produced with funding from the Climate Change Capacity Development (C3D+), which is supported with core funding from the European Commission (EuropeAid/DCI-ENV/2008/149684/TPS) with supplementary funding from the Austrian Development Cooperation and the Swiss Government.
(0) Comments
There is no content