Using climate information for supporting cacao plantation over Gorontalo region
- Level: Advanced
- Time commitment: 1-2 days
- Learning product: Worked example
- Sector: Agriculture
- Language: English
- Certificate available: No
This article was developed during training with BKMG as part of a capacity-building project in Indonesia and the Philippines. Please have a look if you’re interested in the training slides.
I. Introduction
Cacao is a shade-loving plant tropical plant and the natural habitat of cacao is in tropical forests. Cacao is a tree crop which is highly suitable under different production systems such as mono-crop, inter-cropping and agro-forestry. Indonesia has become the third largest cacao producer in the world after Ivory Coast and Ghana (Aria, 2014), however, since 2002 the plantation area of cacao in Indonesia has decreased and production fluctuates from year to year (BPS, 2013). According to the head of ASKINDO (Indonesian Cocoa Association), the production continued to fall due to extreme climate change, pest attacks, many old plants, and there is no extension of cocoa plants (Aria, 2014). Indonesia has a large potential chocolate domestic market as well as easy access to the ASEAN region, China, Europe, and India chocolate markets. To meet the existing grinding capacity and market opportunity, Indonesia has to increase the production of cacao beans. Moreover, good cacao plantation and chocolate production will contribute to reduce deforestation and then to reduce emissions from deforestation and forest degradation (REDD+, climate change mitigation), and to enhance climate resilient agriculture (climate change adaptation). At the same time, the agribusiness could help the inclusion of local community and the reduction of poverty in Indonesia.
The climate is one of the important factors that affect the production of cacao; therefore, to enhance and sustain the production, it is important to assess how current conditions and projected changes will impact cacao production. This report, particularly looks at the potential of a cacao plantation in Gorontalo region on Sulawesi island. Gorontalo has an area of 12,435 km2 and the surface area mostly are hills. The altitude from sea level is 5-25 m. This region has a hot enough temperature with the minimum temperature 22.20C in February and the maximum 34.20C in October. Highest rainfall occurs in July with 244 mm. The major crops that are planted in Gorontalo are coconut followed by cacao and coffee, and the production of cacao has increased from year to year in the region (BPS Gorontalo, 2013).
The aims of this article are to give general knowledge and recommendations on climate information, including the projected trends of rainfall as well as the current condition of temperature to support a cacao plantation strategy particularly for farmers in Gorontalo.
II. Key Question
How do current trends and long-term projected changes in temperatures and rainfall in Gorontalo district affect the potential for Cacao production, and how can any impacts be addressed?
III. Methodology
This analysis employed two sets of climate data on rainfall and temperature. The data are obtained from weADAPT.org and CIP (climate information portals) as well as the observational data from BMKG. The period of data fromweADAPT-CIP is 1977 – 2007. The observational data from BMKG is applied to compare the data ofweADAPT– CIP.
IV. Result and discussion
4.1. Historical climate data on weADAPT-CIP over Gorontalo Region
The timing of the onset and the cessation of the rainy season is important for crop management including cacao plantation. It is clearly shown that for the 1997-2007 period, the rainfall pattern in Gorontalo region characterized by wetness over the years. The climate monthly average shows almost every month has rainfall more than 50 mm (figure 1). It indicates that only August and September have rainfall below 50 mm/month. Therefore, Gorontalo did not have clear differences between wet and dry seasons.
The driest month has historically been August with the monthly average of around 26 mm between 1997 and 2007. The wettest month has been May with the average total monthly rainfall of 130 mm. The minimum average temperature was 22.5ºC in August, while the maximum average temperature was 32.5ºC in October.
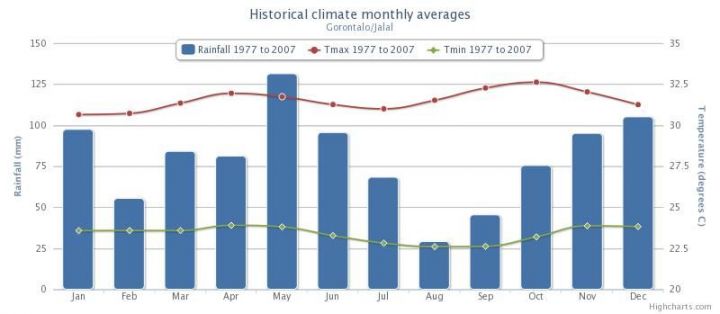
Figure 1. Historical climate monthly average in Gorontalo between 1977 and 2007. The temperature changes mildly throughout the year. There is no clear monsoon dry and wet seasonality in Gorontalo.
The total monthly rainfall data for the period of 1977-2007, as shown in Figure 2, indicates that the highest total monthly rainfall occurred in May 1978, namely 348 mm.
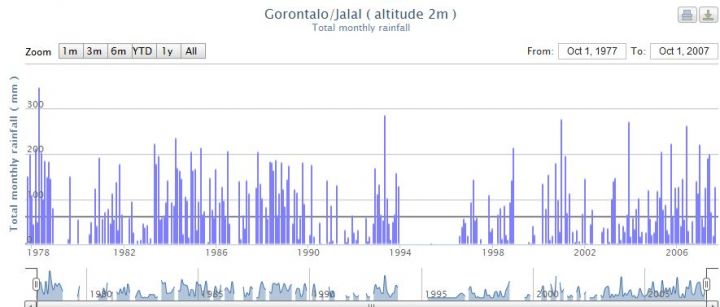
Figure.2. Total Monthly Rainfall in Gorontalo
4.2. Future climate projections
From the statistical downscaled data on A2 emission scenario projection for Gorontalo shown in figure 3, the total rainfall is likely to change in 2046 – 2065. The 2046 – 2065 projections suggest:
- Total monthly rainfall is likely increase except in March, April, and August.
- All models suggest total monthly rainfall will increase during July, September, and November
- September is likely increase significantly relatively compared to the observed rainfall.
- August is already dry, but it will get even drier.
Comparing the A2 and B1 SRES Scenario emission, the B1 SRES Scenario projected drier condition than A2 SRES Scenario, especially in January, February, March, April, June, and August.
- Generally, the patterns of projection show similar results with A2. It is likely to increase in total monthly rainfall over the year except in August.
- Most models suggest increases in total monthly rainfall during May and September.
-
Especially in August, it is projected to be drier.
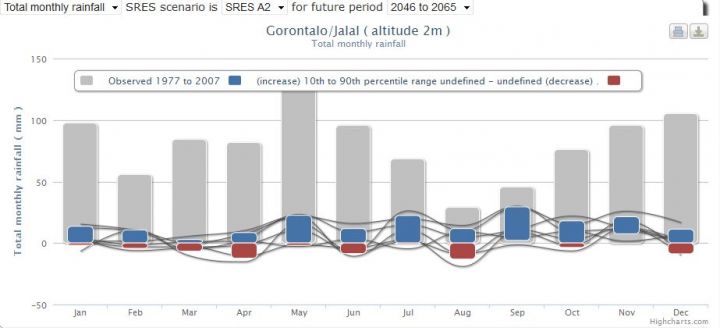
Figure 3: Total Monthly Rainfall Projection for Period of 2045 – 2065 Based on SRES A2 (2046 – 2065) in Gorontalo. The lines show the results for each of 7 climate models.
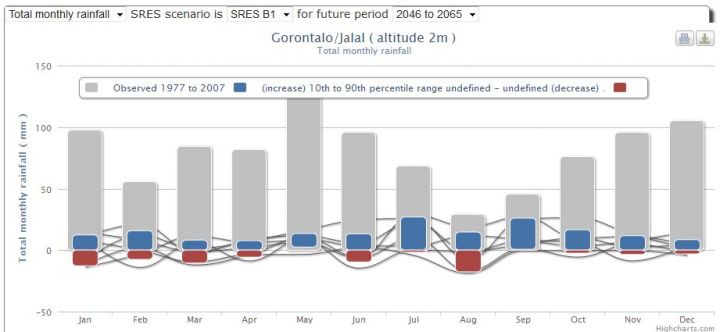
Figure 4. Total Monthly Rainfall Projection for Period of 2045 – 2065 Based on B1 (2046 – 2065) in Gorontalo
4.3. The Projection of Total Monthly Rainfall Comparison Between Gorontalo Station and Toli-Toli Station
When we look through the data from the Toli-Toli station, the future climate projections based on SRES A2 Scenario suggest similar patterns to our earlier interpretations for the Gorontalo station. For example, in terms of rainfall, amount of rainfall will increase over the year. The amount of monthly rainfall getting drier is projected more with B1 than A2 Scenario. The amount of rainfall decreasing is projected in January, March, June, August and December in the both stations. However, in contrast to Gorontalo station, the amount getting drier is more in Toli-toli.
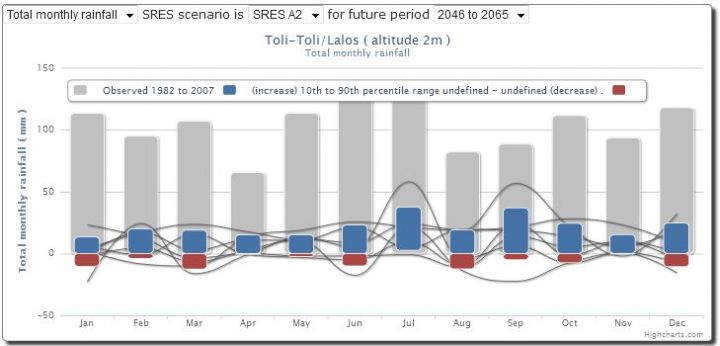
Figure 5. Total Monthly Rainfall Projection for Period of 2045 – 2065 Based on A2 (2046 – 2065) in Toli-Toli
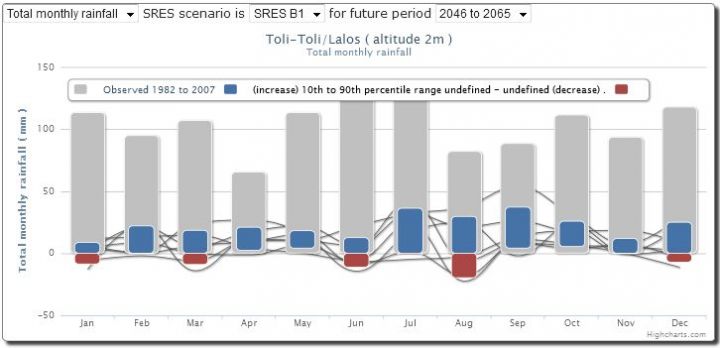
Figure 6. Total Monthly Rainfall Projection for Period of 2045 – 2065 Based on B1 (2046 – 2065) in Toli-Toli
4.4. Recommendation for Cacao Plantation Based on Climate Information
The growth requirements for cacao released by the Research Centre of the Ministry of Agriculture of The Republic of Indonesia (table 1) shows cacao best grow in the region that has annual rainfall 1500 – 2500 mm or 1 – 2 dry month. It means that currently there is less rainfall than would be needed for optimal Cacao production.
There are 4 levels of land suitability, namely S1 (very suitable), S2 (suitable), S3 (marginal suitable) and N (not suitable). Based on the table 1, a land will be very suitable for cacao plantation if it has an annual rainfall about 1500 – 2500 mm. So, historical data for Gorontalo region (Figure 1) and the annual rainfall based on weADAPT-CIP indicate that Gorontalo could be categorized as N area for cacao plantation because the annual rainfall in this area is about 935 mm. However, based on the trend projection (Figure 2 and 3) for the period of 2045 – 2065, it is likely that monthly monthly will increase in this region (except in August and September). This could be an optimistic trend for cacao farmers in Gorontalo as the suitability will increase as a result of a rise in precipitation.
When we look at temperature, the other growth requirements for Cacao, it is not an obstacle for cacao production. The average temperature over Gorontalo region is between 22oC – 32oC (Figure 1) which is suitable for cacao growth.
Climate and climate change is one of the main issues for cacao plantation. Our analysis suggests that efforts from the district government to improve water drainage structures and irrigation canal might help increase the suitability level for cacao plantation. A further detailed technical study on the assessment and ranking of adaptation options would complement this work and would be important in making decisions regarding the coastal zone. Further research in creating the new cacao varieties that possibly be planted in a region that has less annual rainfall is also important to help farmers in Gorontalo.
This article was developed during training with BKMG as part of a capacity-building project in Indonesia and the Philippines. For more information on the project, including training slides, please see here.
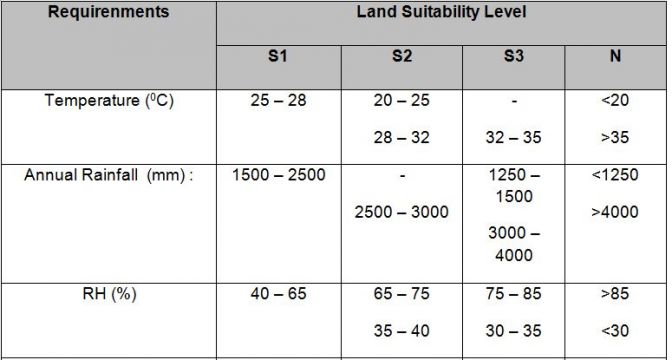
Table 1. Land Suitability Level for Cacao
References
Aria, P., 2014. ProduksiKakao Nasional Terus Turun (National cacao production continues decline). http://www.tempo.co/read/news/2014/04/15/090570881/Produksi-Kakao-Nasional-Terus-Turun
BPS (Indonesia Statistical Bureau), 2013. Indonesia in Figure 2013. http://www.bps.go.id/tnmn_pgn.php?kat=3&id_subyek=53¬ab=0
BPS, 2013. Gorontalo in Figure 2013. http://gorontalo.bps.go.id/
Research and Development Center, Ministry of Agriculture of the Republic of Indonesia. website: http://bbsdlp.litbang.pertanian.go.id/
Related articles
Effects of climate change on Mung Bean production in Sumbawa, Indonesia
Using climate information to support adaptation planning and policy-making: A step-by-step guide
(2) Comments
I can use your climate information in our cacao plantation
Hi @Carmelo Pascual Verdan, you might also find this article useful: https://www.weadapt.org/knowledge-base/using-climate-information/guide-to-using-climate-information
There is some climate data – provided by the Climate Information Portal – that you can access through the weADAPT adaptation layer: https://www.weadapt.org/placemarks/maps
@Chris Jack, is this the most recent data? If not, perhaps we can suggest another data source to Carmelo?