Vulnerability Indicator Mapping

- Level: Advanced
- Time commitment: 1-2 hours
- Learning product: Tool/method summary
- Sector: Multi-sector
- Language: English
- Certificate available: No
Background to the method
In order to assess how climate change might impact certain livelihoods resources and social groups it is necessary to establish the level of exposure of these to relevant climate hazards that impact the region or sector of interest.
This module is an introduction to developing indices of current vulnerability to climate and climate change. This makes use of a vulnerability exposure matrix, to identify exposure units and issues/threats of the exposure region, sector or community and guide the user to identify suitable indices.
Key points
- Identification of vulnerable livelihoods groups, activities or specific population
- Identification of climate or other hazards
- Understand importance of impacts of historic trends in climate and hazard events
- How are the climate and other hazards changing
- Understand the issues in identification of vulnerability indicators for current and future vulnerability
- Understand the complexities in using maps for mapping of vulnerable groups, identification of hotspots where further research is required, issues relating to spatial scale of data available, identify factors that contribute to current vulnerability and for communication of vulnerability and hazards
Process of applying this tool/method.
- Use a vulnerability matrix as a way to identify the region, sector, community, or livelihood of interest to identify who is vulnerable and to what.
- Identify major climate and other threats and associate relevant climate variables.
- Identify indicators relevant the and rank them. The aim is to link the indicators to the specific concerns recognised by the exposure matrix.
- Group the indicators into dimensions of vulnerability.
Some simple steps that can be used to identify indicators of vulnerability are shown below (taken from AVA Assessment of Vulnerability for Adaptation, SEI, 2005).
- Identification of the priorities and scales of assessment and exposure units
- Review and adapt the indicator template to suit local needs; identify the key indicators to use and the broader attributes of vulnerability
- Collect data on each indicator; use expert judgement where local data might be missing or insufficient
- Compile profiles of the indicators.
- Access historic climate data and compare with historic events.
- Identify future hazards, through climate scenarios as a starting point for assessment of future vulnerability.
Strengths and Weaknesses
In a recent detailed critique of vulnerability assessment, Hinkel (2011) identified six purposes that might be served by vulnerability indicators for informing decision-making based on evidence gathered from the literature:
(i) To identify mitigation targets (Verdict: No. Global scale vulnerability indicators, even if they could be defined, would be useless for setting mitigation targets, which involve describing trade-offs between different dimensions of global impacts. These impacts need to be estimated explicitly using impact models)
(ii) To identify particularly vulnerable people, regions or sectors (Verdict: Yes at local scales, where exposure units are narrowly defined by a few variables. No over large regions and globally, as the generalisations required in developing a composite index will inevitably obscure the complexity of regional processes that can be modelled explicitly using impact models)
(iii) To raise awareness of climate change (Verdict: No, because the presentation of indicators on their own is meaningless without effective techniques for communicating the information they contain in a form that is readily understandable by stakeholders. It is argued that the vagueness surrounding the concept of vulnerability can only add to the challenge of communicating the key messages)
(iv) To allocate adaptation funds to particular vulnerable regions, sectors or groups of people (Verdict: No, both internationally and at national scale. The key issue here is the inherent subjectivity involved in selecting indicators and then combining them into indices. Since the scientific methods employed can readily be contested, there would be ample opportunity to offer counter-proposals for funding priorities to suit different parties. At national scale, it is likely that more advanced knowledge would be available from impact models than can be gleaned from composite indices)
(v) To monitor the performance of adaptation policy (Verdict: No. The success of adaptation policy cannot usefully be measured in terms of vulnerability. Instead, it could be monitored as an outcome indicator of the amount of harm observed (i.e. observed impacts) and/or as a process indicator of the progress in implementing adaptation measures)
(vi) To conduct scientific research (Verdict: No. Scientific inquiry can only be taken forward by formulating specific research hypotheses about cause and effect that can be tested by measurement or modelling rather than by applying arbitrary methods in an attempt to quantify the unquantifiable).
In conclusion, Hinkel recommends that if vulnerability indicators are to be developed, they should only serve as high level entry points to further more detailed information behind. A concerted effort should be made to make the problems addressed and methodologies applied more explicit, which also requires that more specific terminology be employed as well, in particular avoiding all but the most qualified use of the all-embracing label “vulnerability” (Hinkel, 2011).
Tool applications
Examples of vulnerability assessment in weADAPT
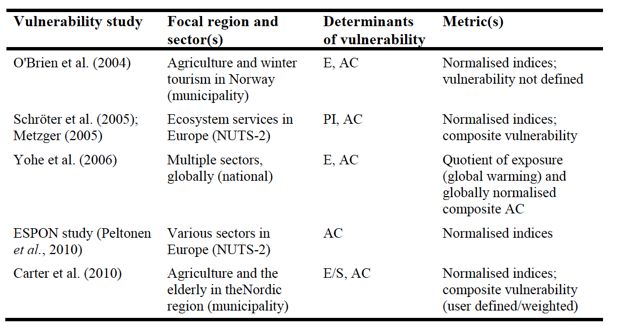
A selection of recent studies applying indicators and composite indices of vulnerability to climate change for different focal regions and sectors in Europe.
Why is this method useful for the field of climate adaptation?
They can be useful as communication and awareness raising tools that are easy for non-experts to grasp and work with, as well as for comparing elements (countries, regions, species, …) and for informing policy makers.
Case studies
Nepal Vulnerability Assessment
Nepal Assessing Conditions and Trends
Identifying Climatic Hazards in Nepal
Nepal baseline vulnerability assessment and social indices
Mali vulnerability assessment and climate trends
Useful web-resources
Examples of global indicators of vulnerability
Climate change, impacts and vulnerability in Europe 2012
Creating an index of social vulnerability to climate change for Africa, Katharine Vincent. August 2004, Tyndall Centre for Climate Change Research Working Paper.
Thornton, P.K. et al, 2006. Mapping climate vulnerability and poverty in Africa, Report to the DfID. ILRI, Nairobi, Kenya, Pp. 171.
Livelihood Systems Profiling: mixed methods for the analysis of poverty and vulnerability. Fabio Pittaluga, FAO Fisheries Department, Nicola Salvati and Chiara Seghieri, University of Florence.
Hinkel, J., 2011. “Indicators of vulnerability and adaptive capacity”: towards a clarification of the science policy interface. Global Environmental Change, 21, 198–208
(0) Comments
There is no content