Trend Analysis and Historical Disturbance Matrix
The following description of this tool and details on how and why it is was applied exists as part of the ‘Adaptation Toolkit’ that was created collaboratively by SEI and ENDA.
Brief Description
This exercise is implemented with a group of community representatives who have lived in study the area for at least 5 years. It requires good facilitation to ask questions that help explore the disturbance dynamics in the past and coping mechanisms as a basis to understand current vulnerability. This activity may require two hours to be completed.
Specific Objectives
The objectives of this exercise are mainly to explore and identify events that have shaped the development of the site in the past (going back 3 to 4 decades) and the coping strategies that were implemented to overcome the negative impacts of these events. This will help in understanding the dynamics that influence current vulnerability.
Expected Outcomes
- Better understanding of the issues/ events/ disturbances that have affected the site in the past decades (including climate-related disturbances)
- Identification of coping strategies that were used by different actors (individuals, households, businesses and organisations)
- Better understanding of the current vulnerability of those in the project area
- Enhance knowledge sharing by helping young people gain knowledge of historical events and build on their past (social memory)
Activities
Step 1: Resource trend analysis
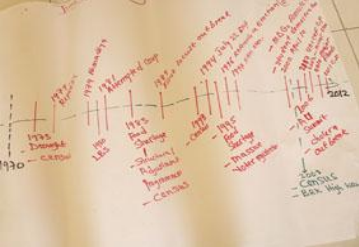
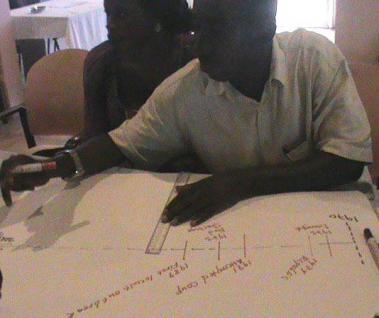
Discuss the events/ disturbances that have affected the site over the past decades. These events can be social, political, economic, ecological, technological changes, etc. Represent them in a historical profile or timeline. When possible, add the year for each important event. If an event lasts for a period of time, add a line to mark this period. Example of disturbance profile is shown below in figure 6.
Step 2: Resource trend analysis
Discuss and describe the changes (both quality and quantity) in key biophysical resources at the site over the past decades using the table shown below. First identify and list key resources based on outcomes of the resource mapping exercise, then discuss trends using a decade as a baseline (e.g. 1970s). You can use stones to populate the table or participants may decide to directly give percentage scores to indicate the changes of the resources in each decade in relation to the baseline. Percentages represent the amount of resource in relation to the baseline. The researcher may access available scientific information in order to compare local perceptions of change with observed trends, this is especially helpful where there are disagreements within the group.
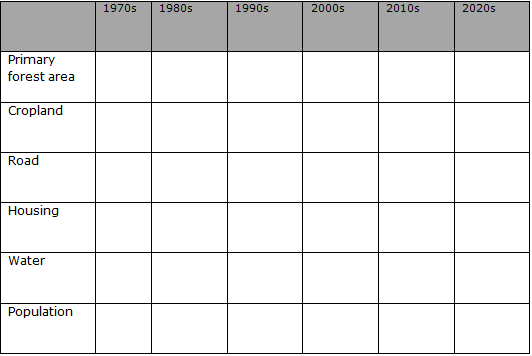
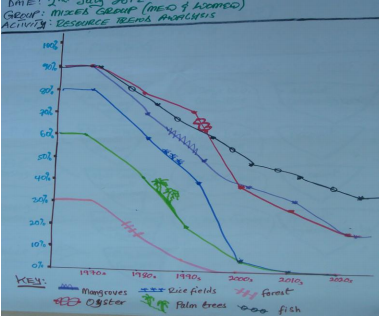
Once percentages are added to the table, you can use the scores to draw the trend lines of the resources over time, see for example the case of Gambia illustrated in figure 10. Discuss in the group the changes for each resource, the main drivers of change and the consequences. Ask about some of the responses or reactions they had to overcome the effects of these changes (i.e. what did they do to recover from negative effects or how did they use the opportunity of positive effects). The graph is a visual way to recognize some trends that may be related, which is interesting to explore and discuss in more depth with the participants. Finally, discuss possible future scenarios for the 2020s and add a percentage to the table and the graph. In the discussion, try to capture why participants envisage the future the way they do.
Step 2: Historical disturbance analysis
Discuss the events/ disturbances that have affected the site over the past decades. These events can be social, political, economic, ecological, technological changes, etc. Represent them in a historical profile. When possible, add the year for each important event. If an event lasts for a period of time, add a line to mark this period. Example of disturbance profile is shown below in figure 9.
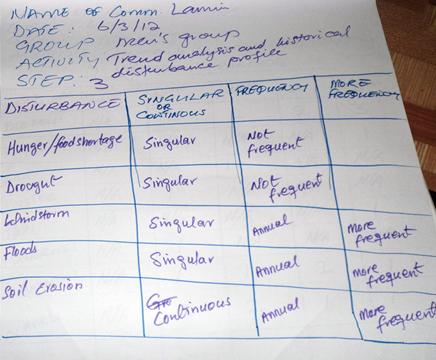
Step 3: Climate-related disturbance analysis
Focus only on the climate-related disturbances identified in the profile and list them in a separate table. If there are additional climate-related disturbances add them to the list. Describe each climate-related disturbance using the table below.
- Is the disturbance a singular event (i.e. a shock) or a continuous event (i.e. gradual change)?
- With what frequency does it happen?
- Has the disturbance become more frequent, more severe and/or more widespread over time and how? An example of this is shown in figure 11.
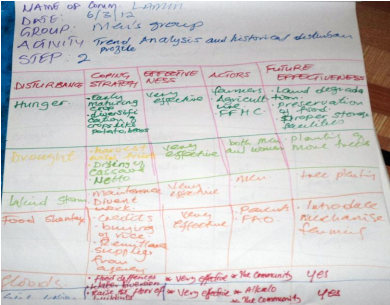
Step 4: Coping strategies
- Identify and describe the coping strategies that were used in response to the most frequent or most severe climate-related disturbances. Add these descriptions to a table
- Encourage participants to discuss the effectiveness of these coping mechanisms and the reasons why they worked or did not work, add the explanations to the table
- Discuss whether coping strategies used in the past were sustainable or not.
- Explore who was involved in implementing the coping strategies and explain if these actors still play an important role today.
- Allow participants to discuss if past coping strategies could be used in present day.
- Take notes of reasons why some coping strategies would still work in current years while others do not. An example is shown in Figure 12.
Resources/ Facilities
The facilities needed for this exercise are:
- Flipcharts
- Markers of different colours
- Post-it notes
- Stones/ pebbles for scoring
- Notebooks to take notes of the discussions
Expected Output
The final products of this exercise are diagrams and tables drawn on flipcharts, as well as a synthesis of the discussions.
(0) Comments
There is no content